Paragliding XC Data Analysis
Discover where and when pilots fly cross-country. Analysis of 11 years of XContest data showing the most reliable takeoff sites by country and season. Only sites with ≥ 2 flights scoring ≥ 100 XContest points are shown.
Issues with oscillations, instability or efficiency in paraglider-based systems, machines or processes?
I support with analysis, modelling, simulation, control, trajectory planning and optimisation of complex dynamic systems.
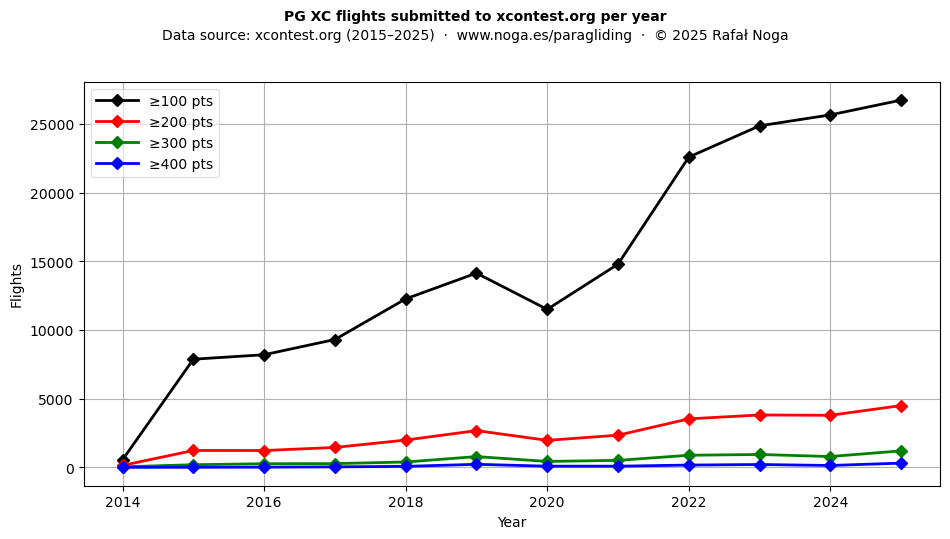
Dataset Overview
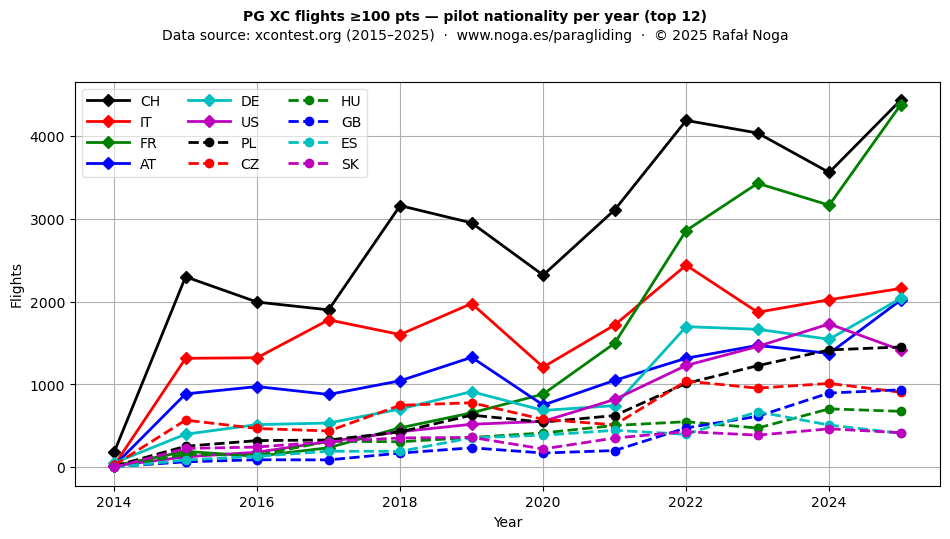
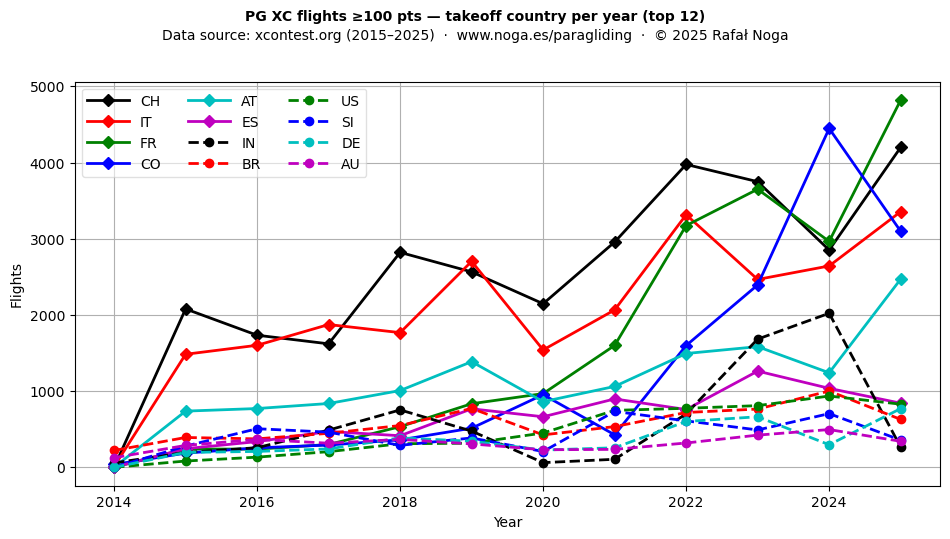
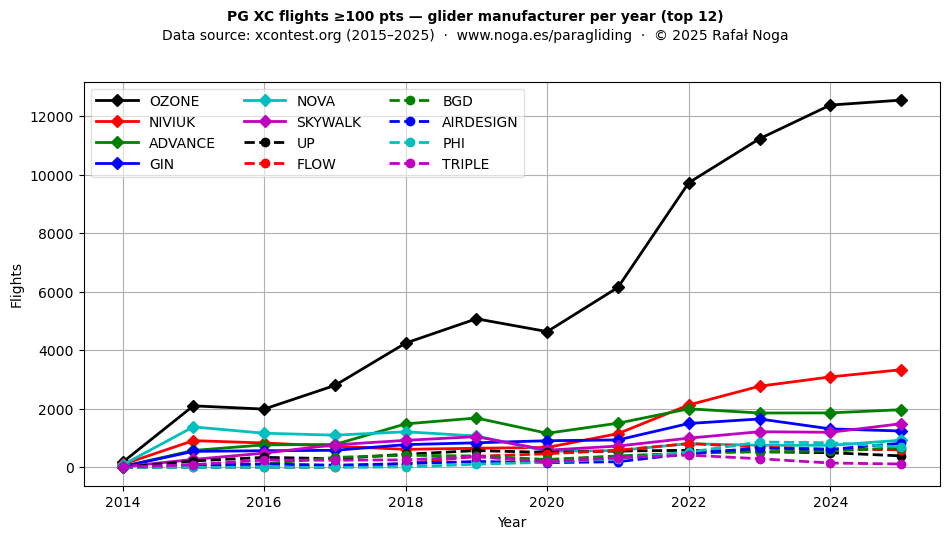
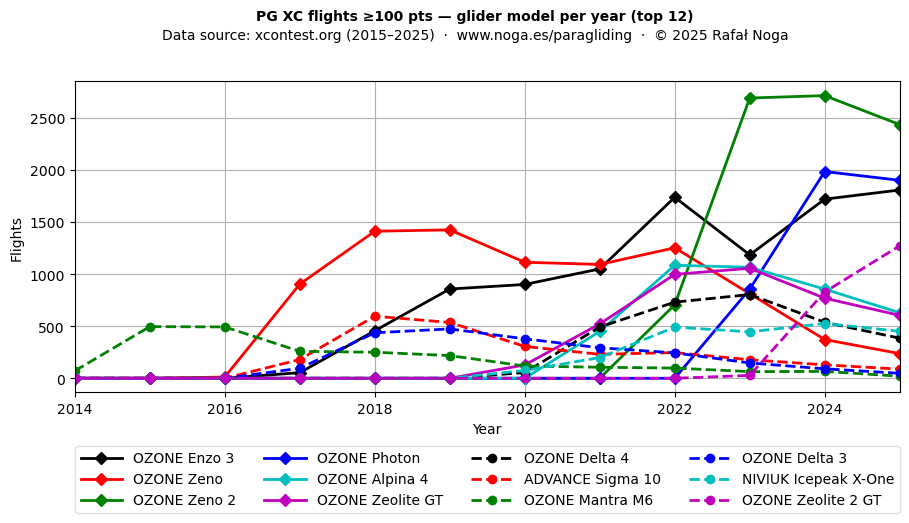
Global statistics from 11 years of paragliding XC data (2015–2025).
Flights per year by points threshold
Pilot nationality per year (top 12)
Takeoff country per year (top 12)
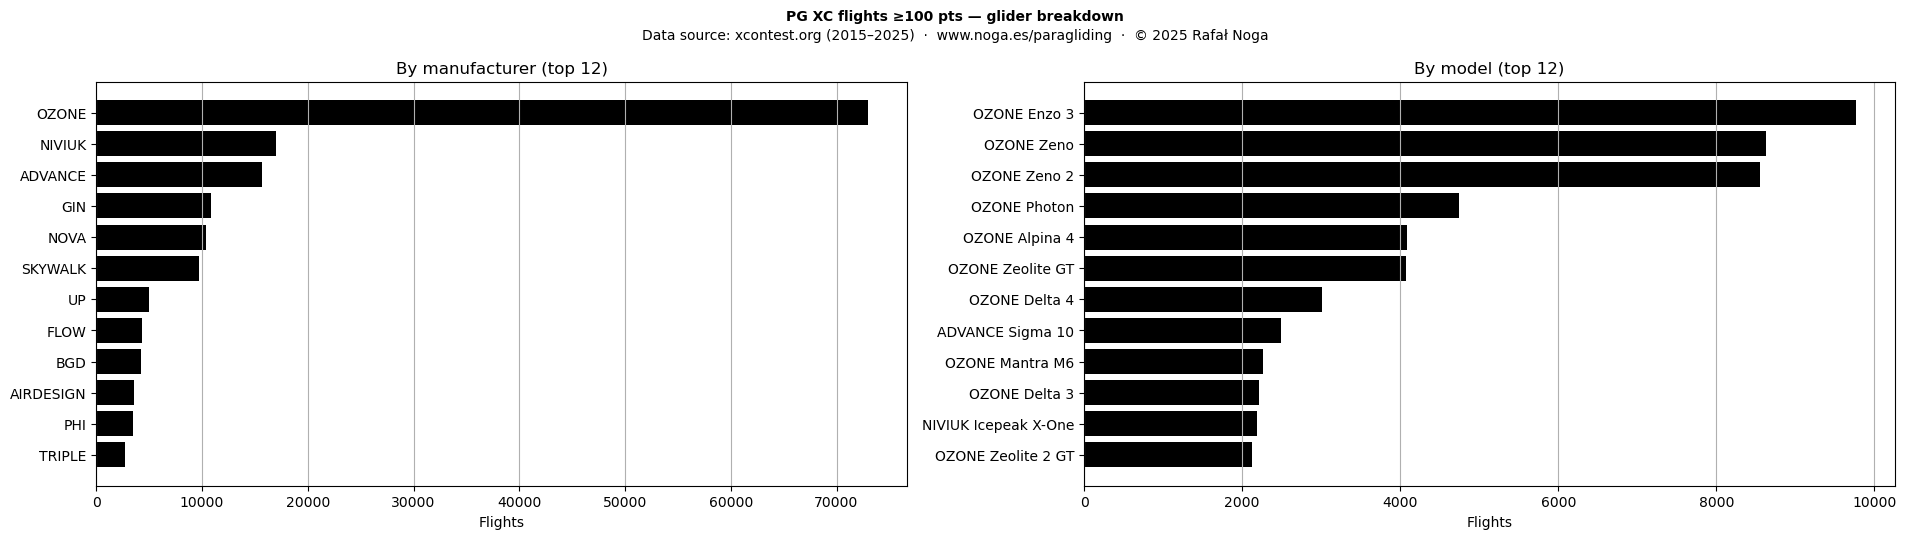
Glider manufacturer per year (top 12)
Glider model per year (top 12)
Glider manufacturer and model breakdown
Interactive Takeoff Map
3,066 takeoff areas with at least 2 Paragliding XC flights ≥100 pts (2015–2025). Click any marker to view all flights from that site. Grey shade = avg flights/yr; circle size = avg XC pts; ring size = max XC pts. Two-pass clustering (2 km + 4 km) groups nearby takeoffs.
Data: xcontest.org · 2015–2025 · Flights ≥ 100 XC pts · 2 km+4 km two-pass · ≥ 2 flights
Coordinates are auto-generated from flight records and may be approximate. Verify the site on the ground before visiting. No warranty.
Know a takeoff that should be on the map? Share the details below.
Download Takeoff Data
Coming soon…
Get notified when new paragliding analyses and data are published.
No spam. Unsubscribe anytime.
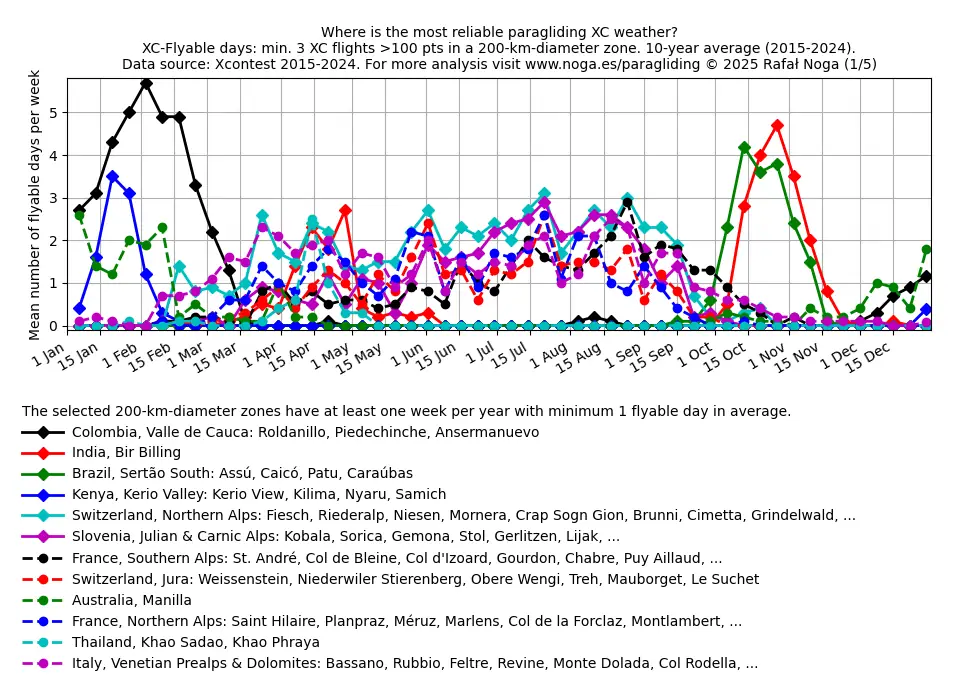
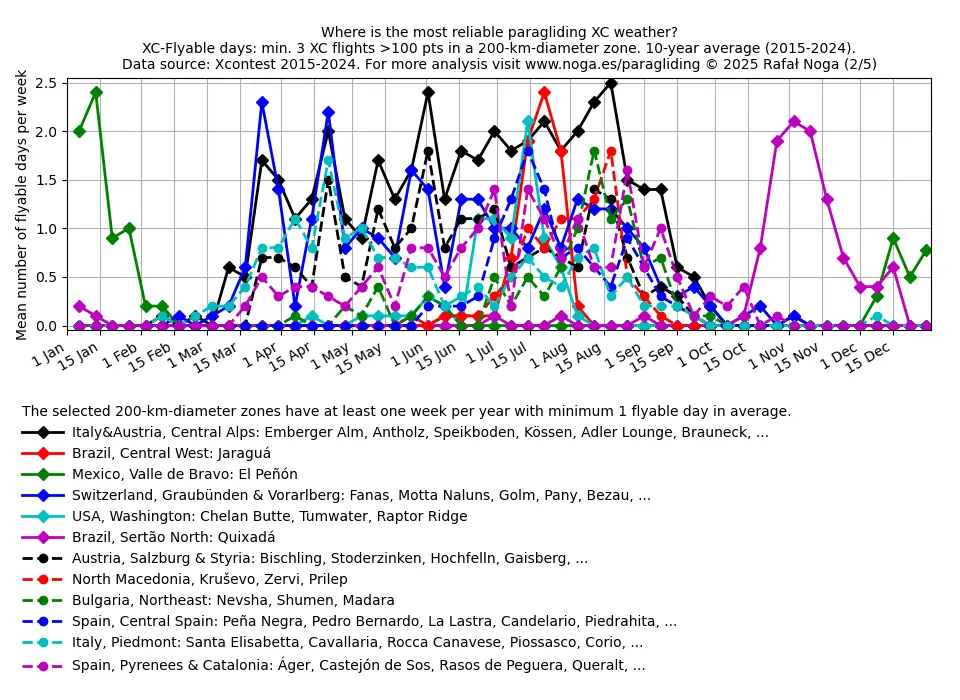
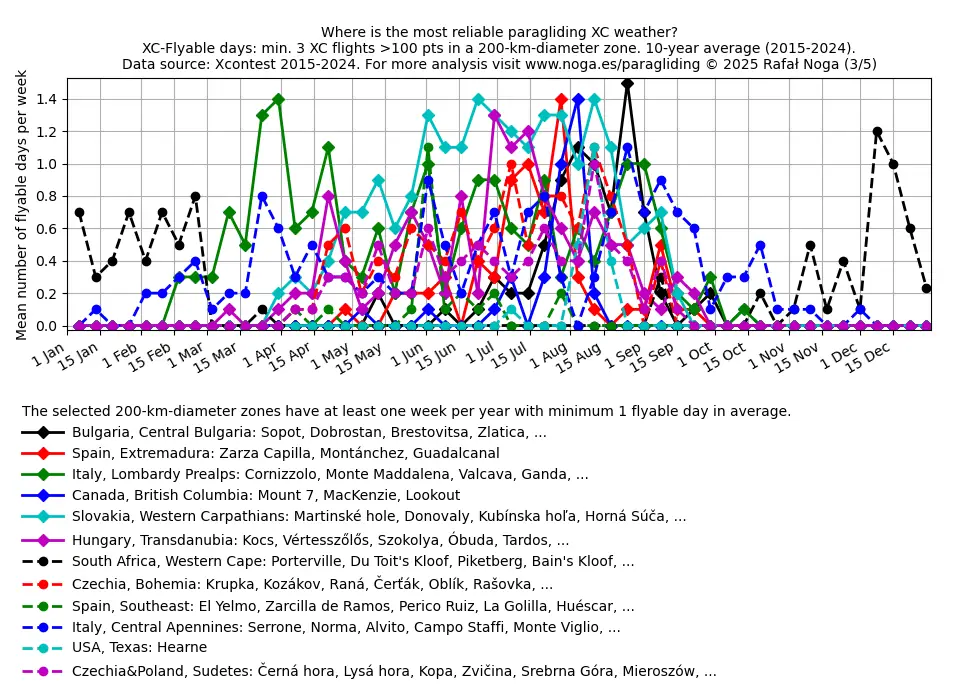
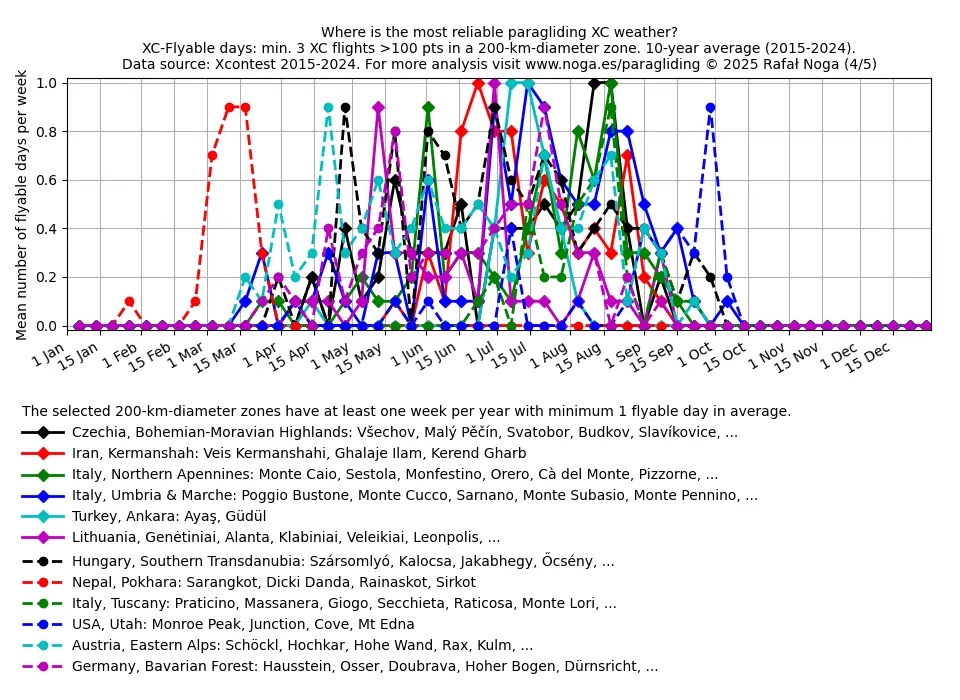
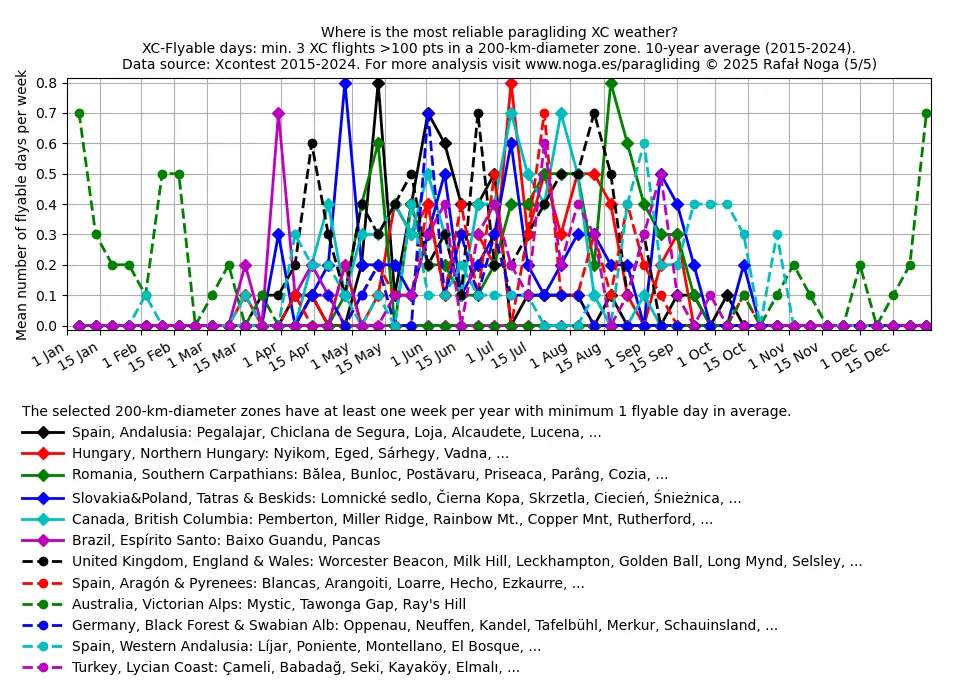
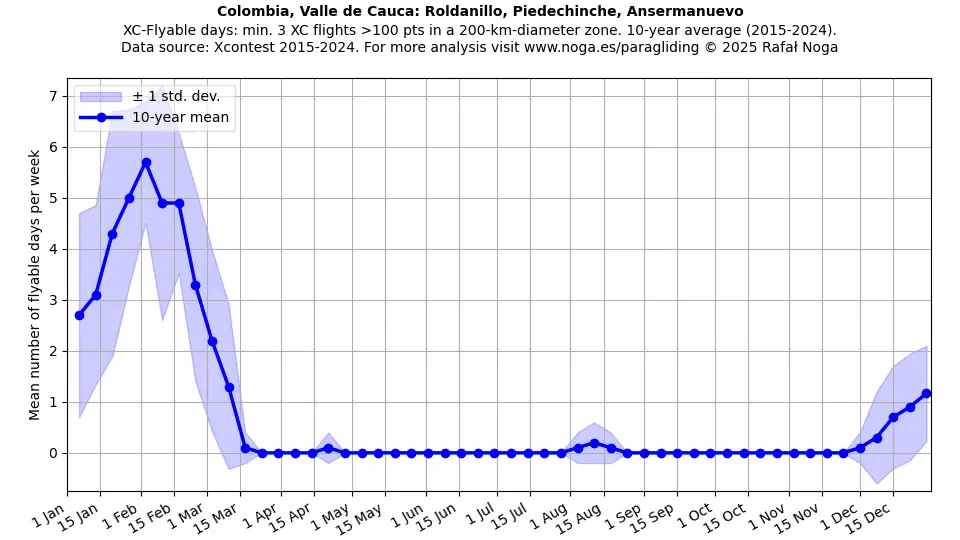
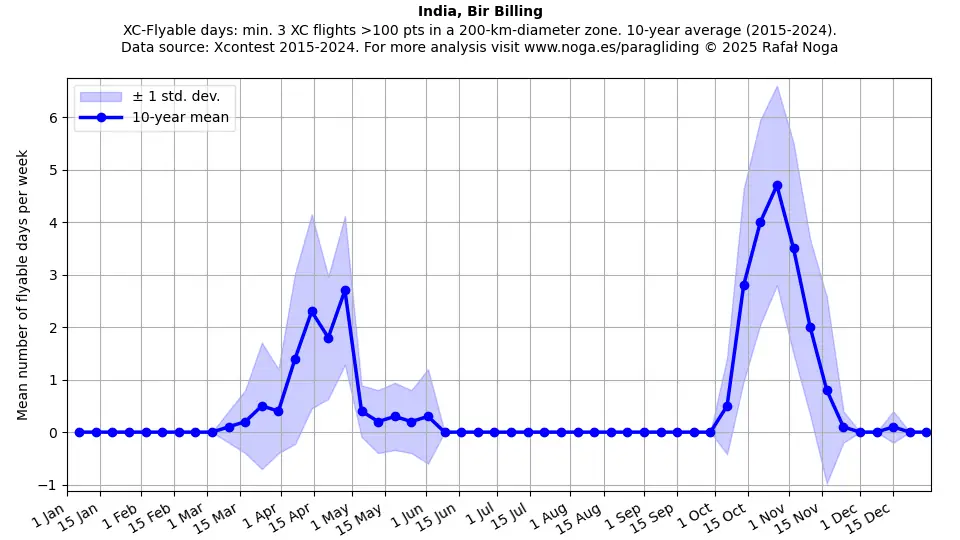
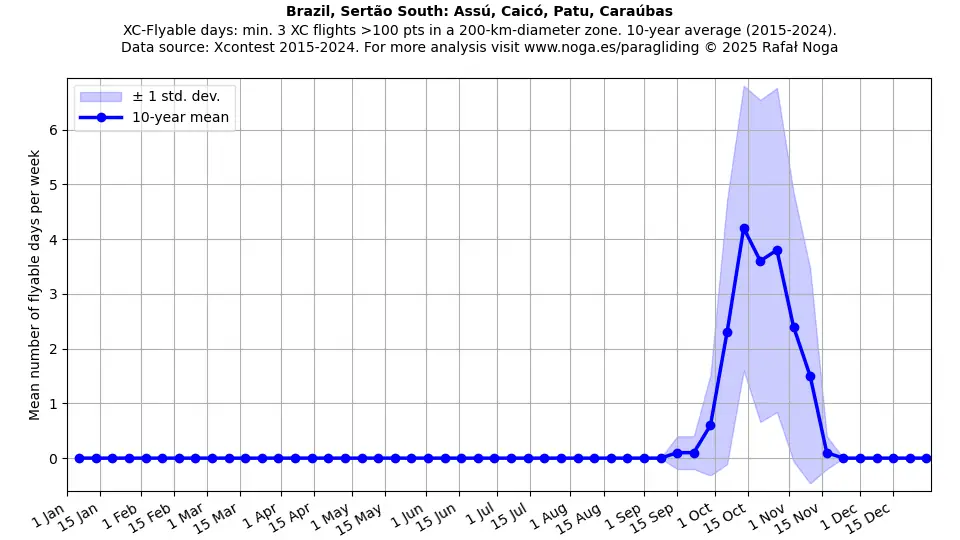
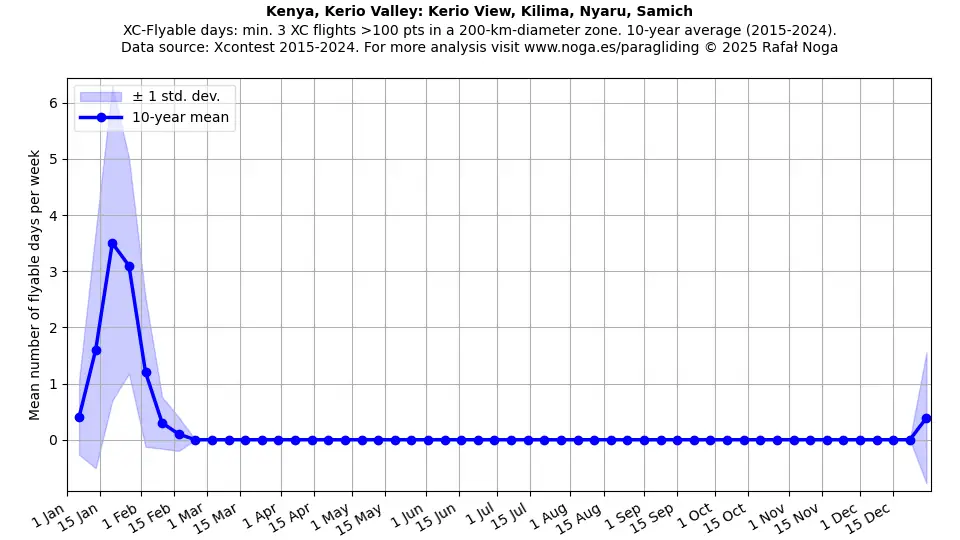
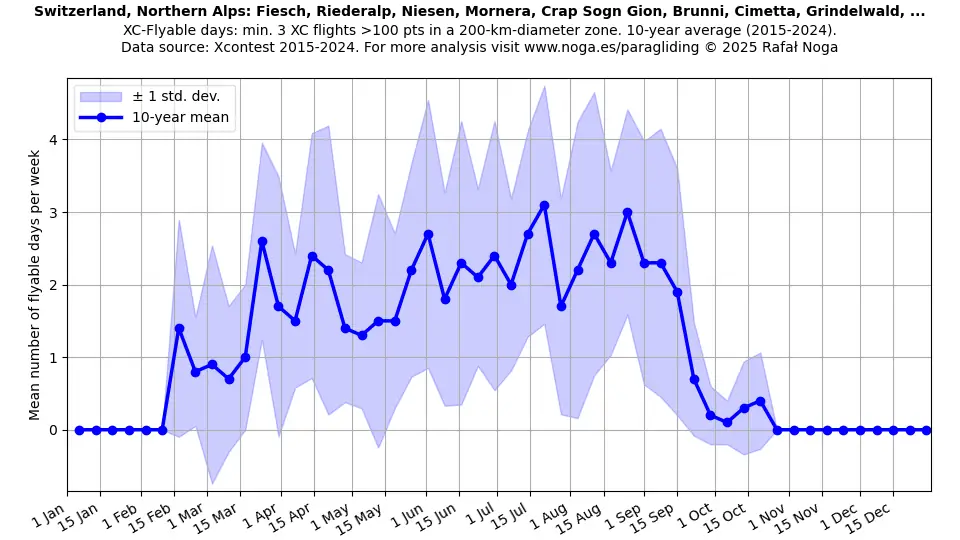
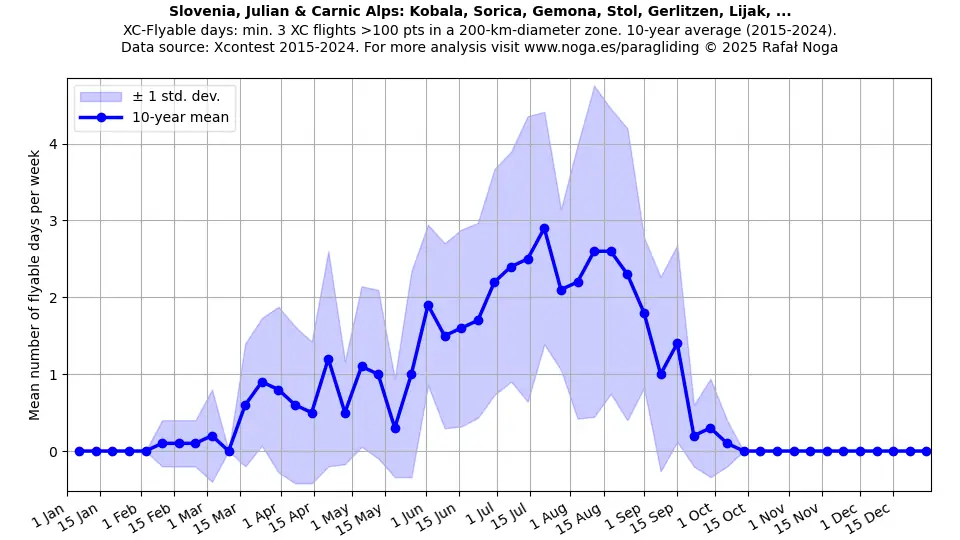
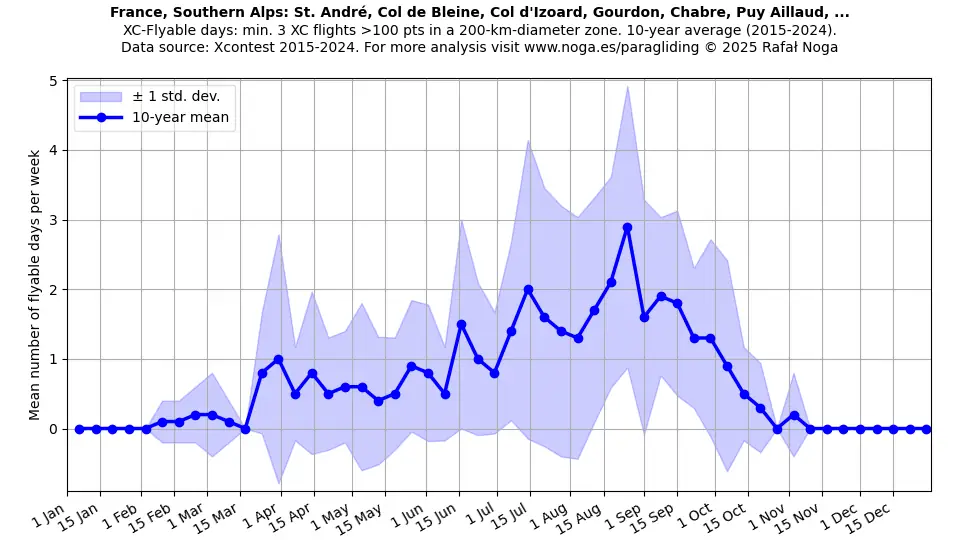
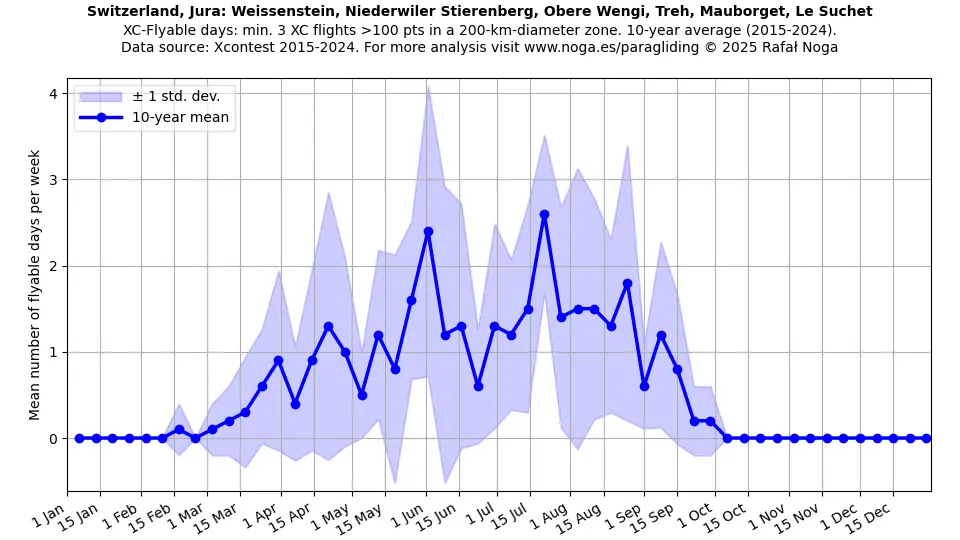
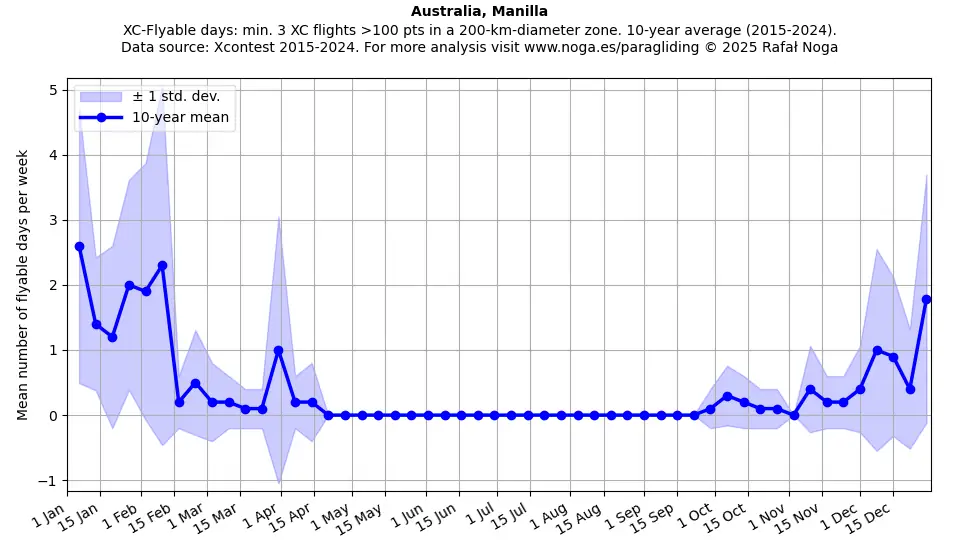
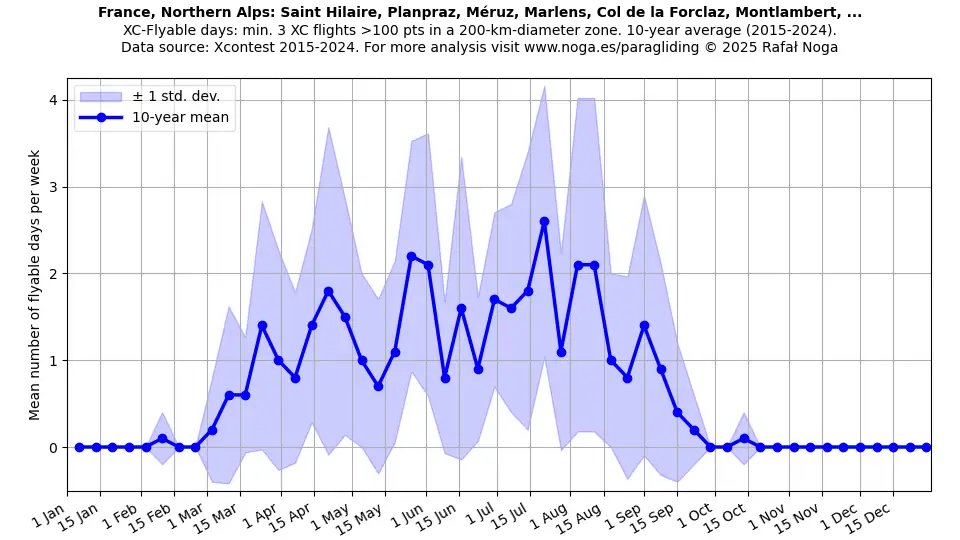
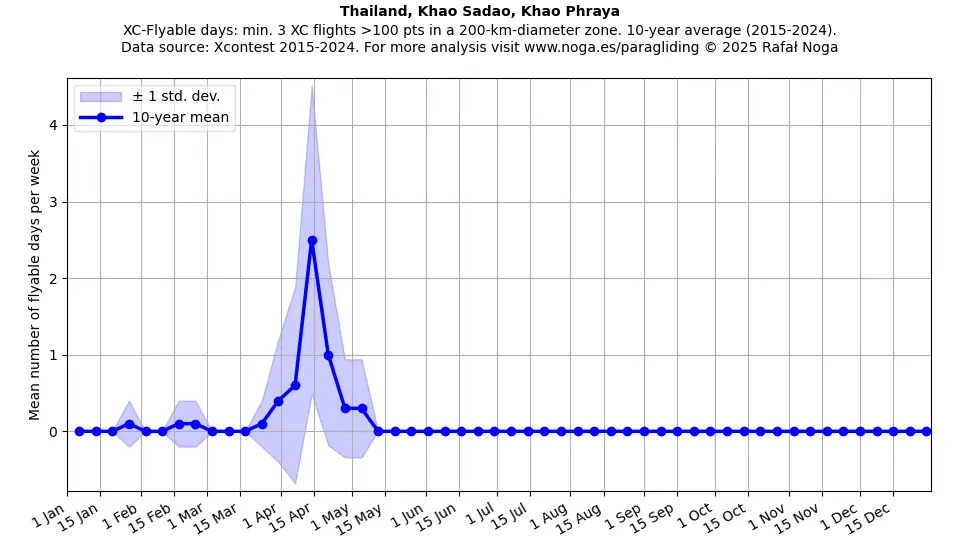
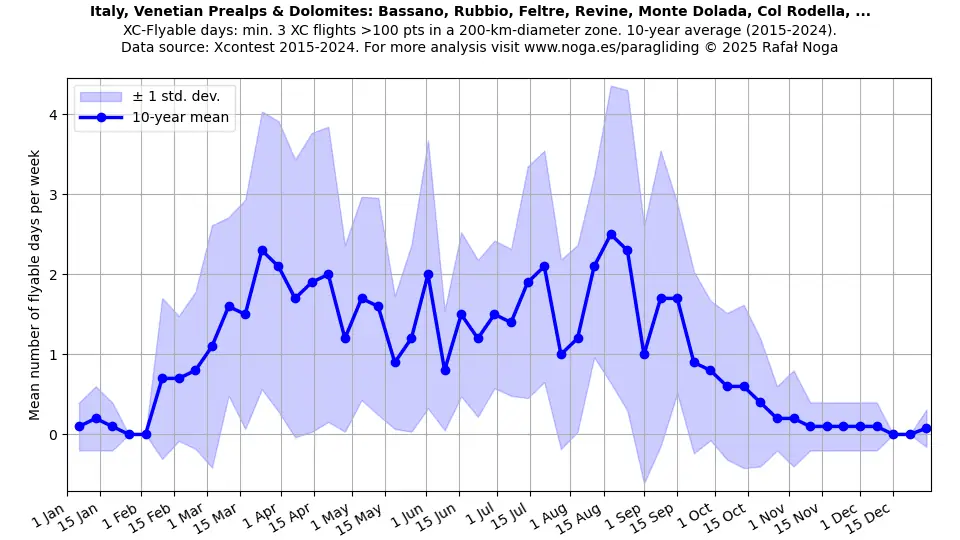
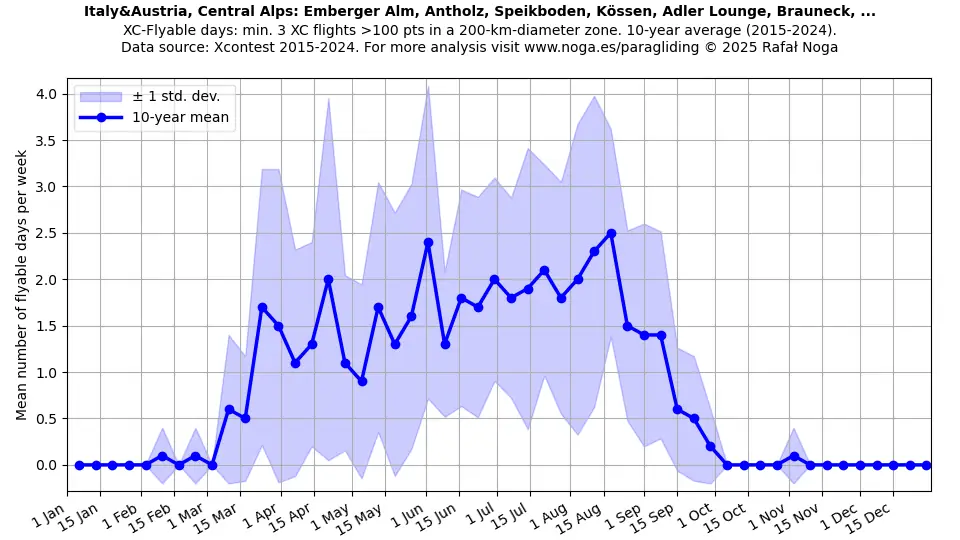
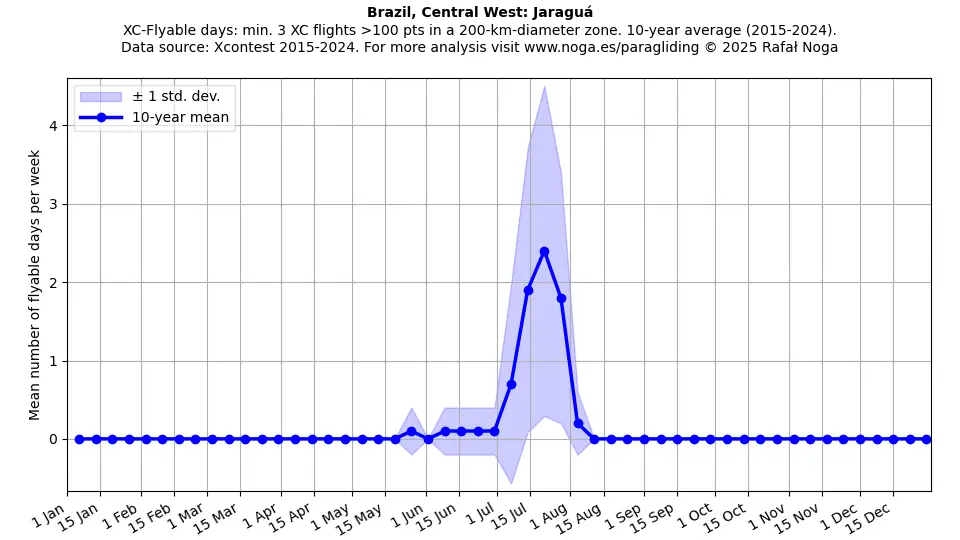
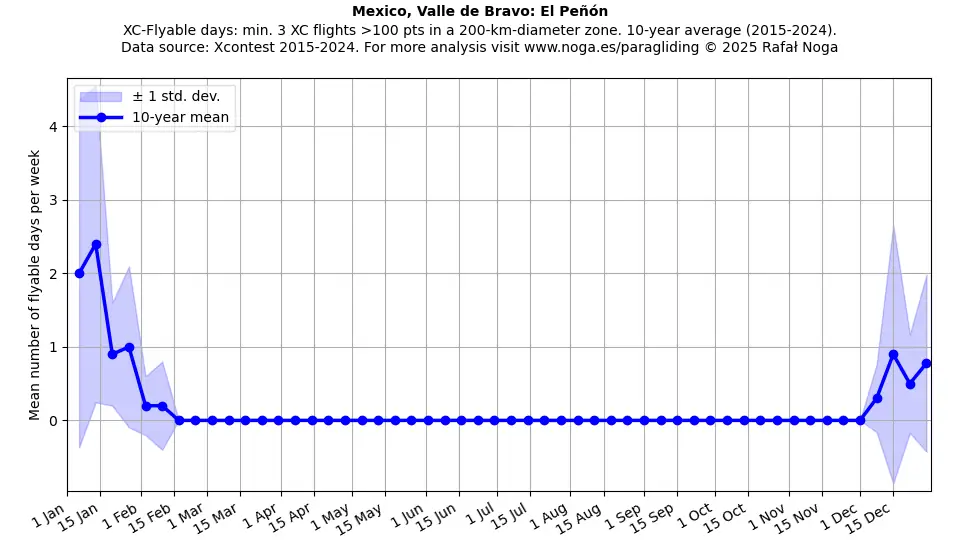
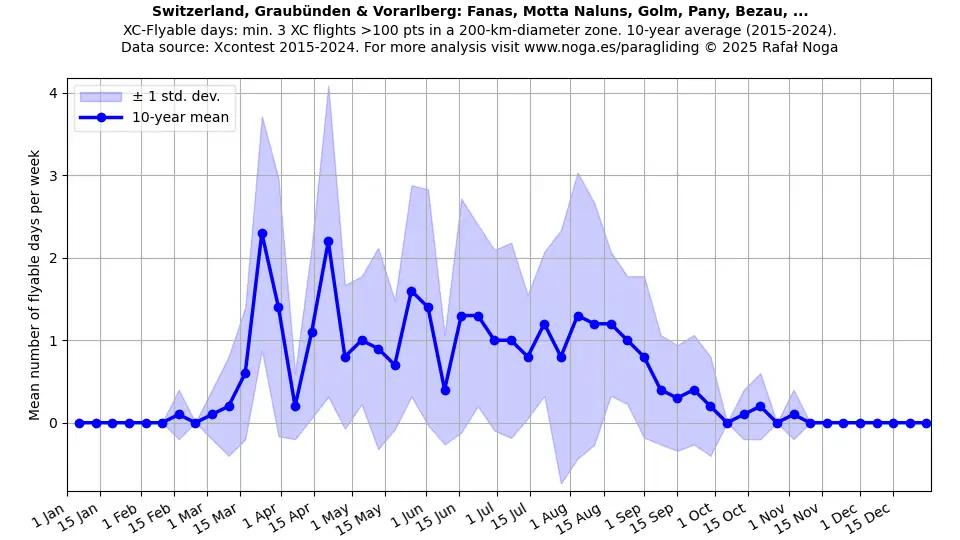
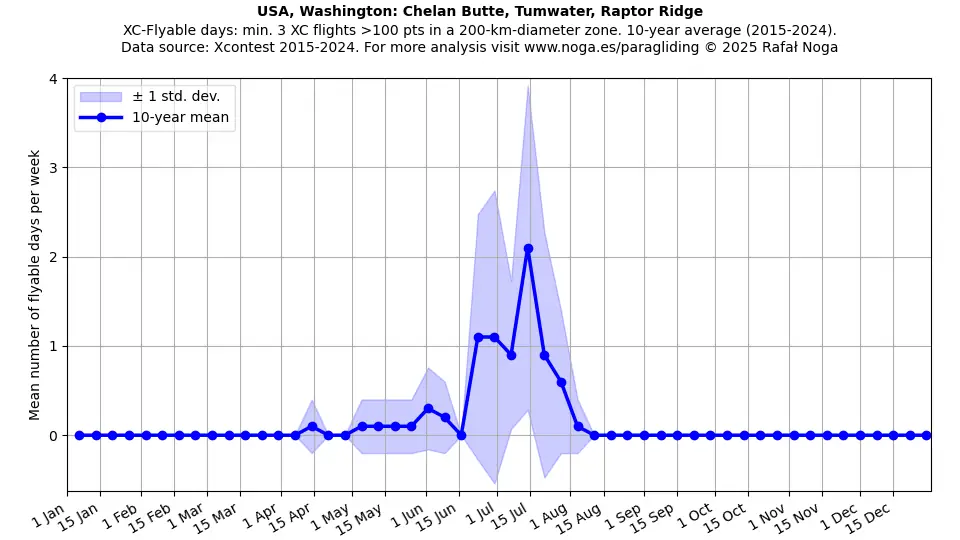
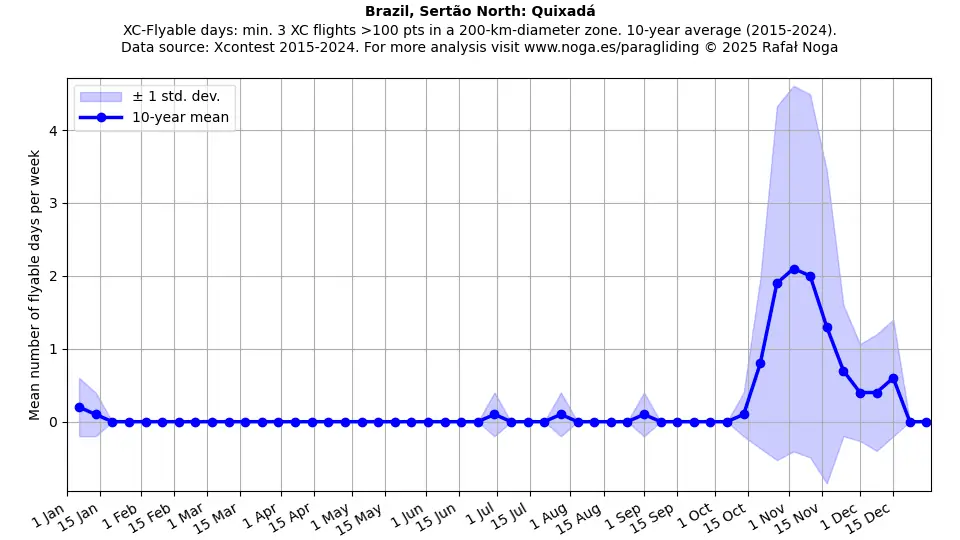
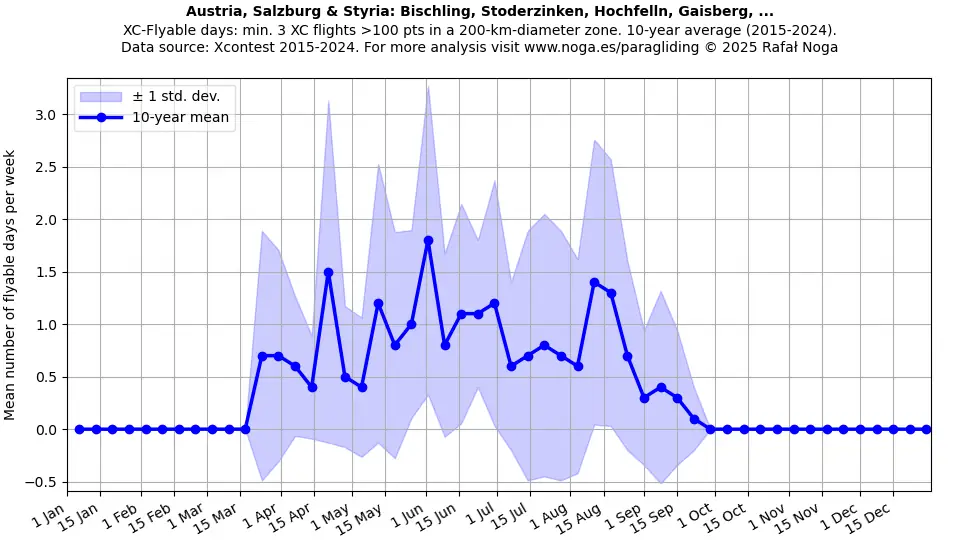
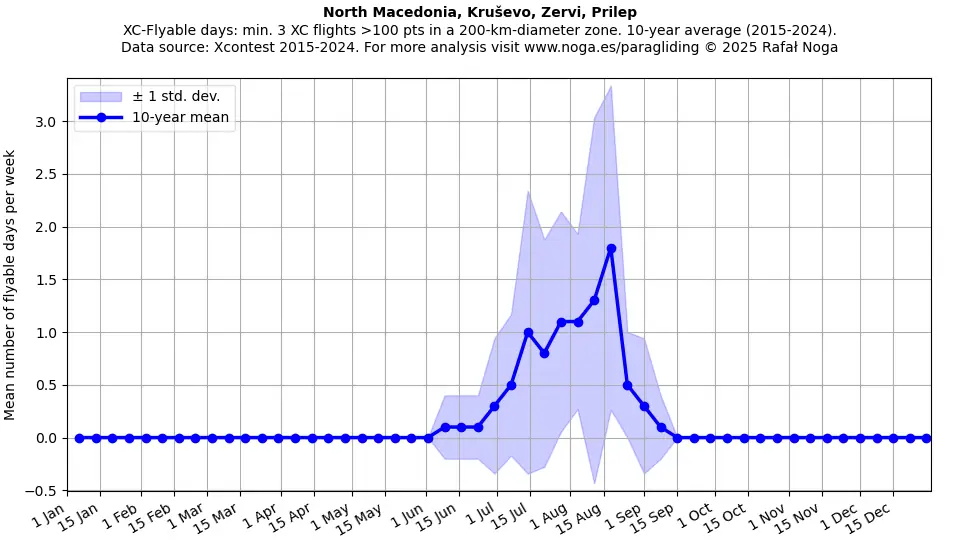
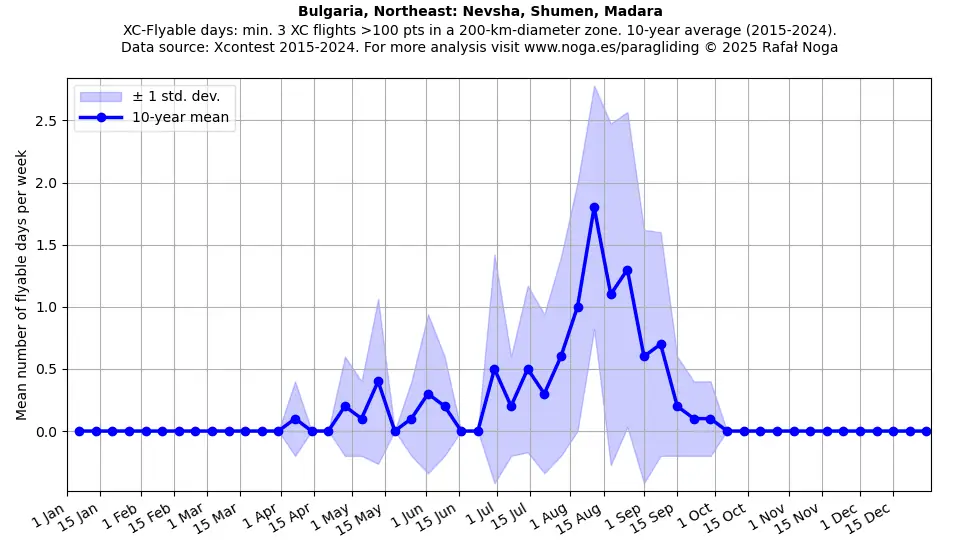
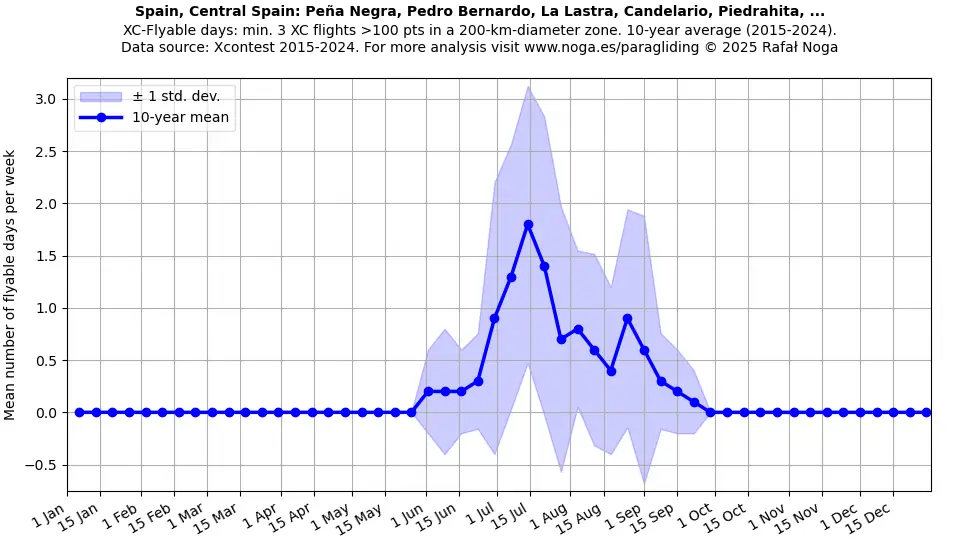
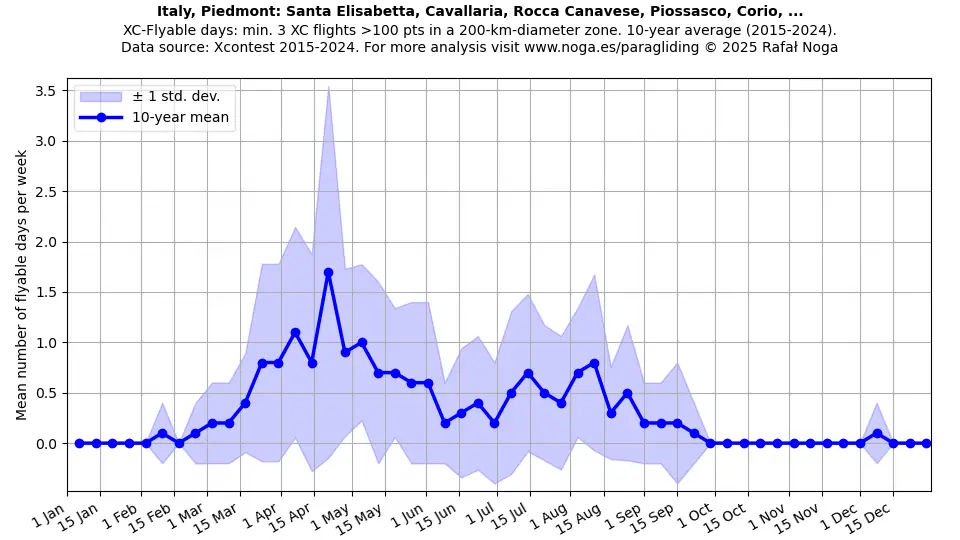
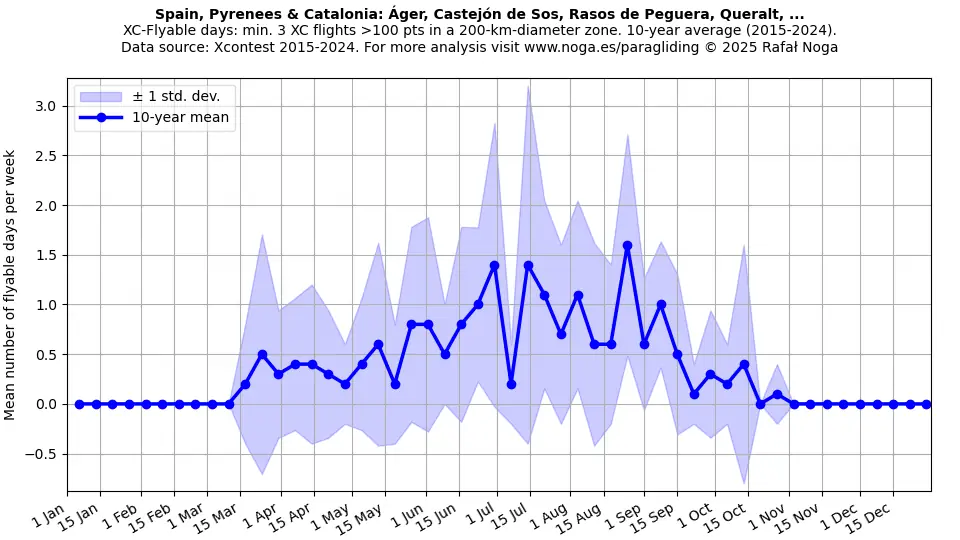
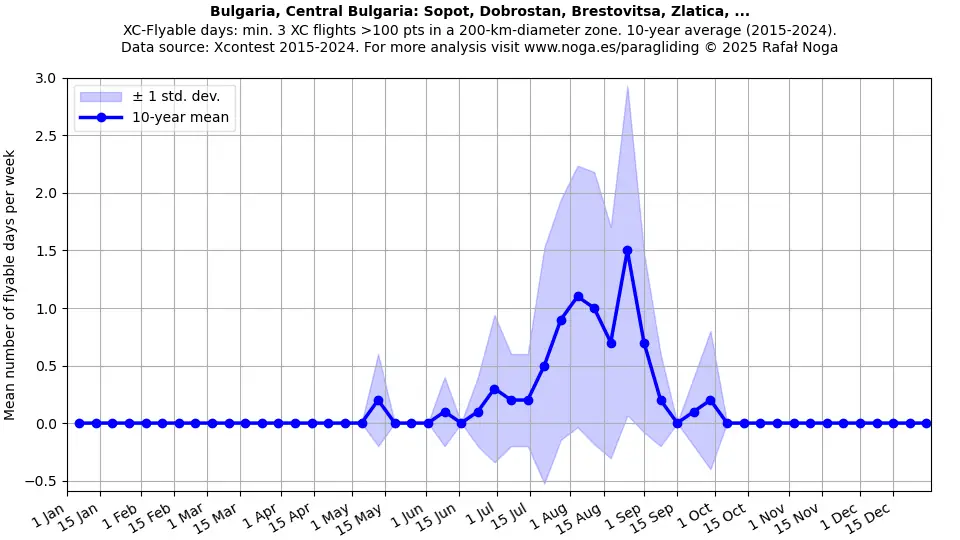
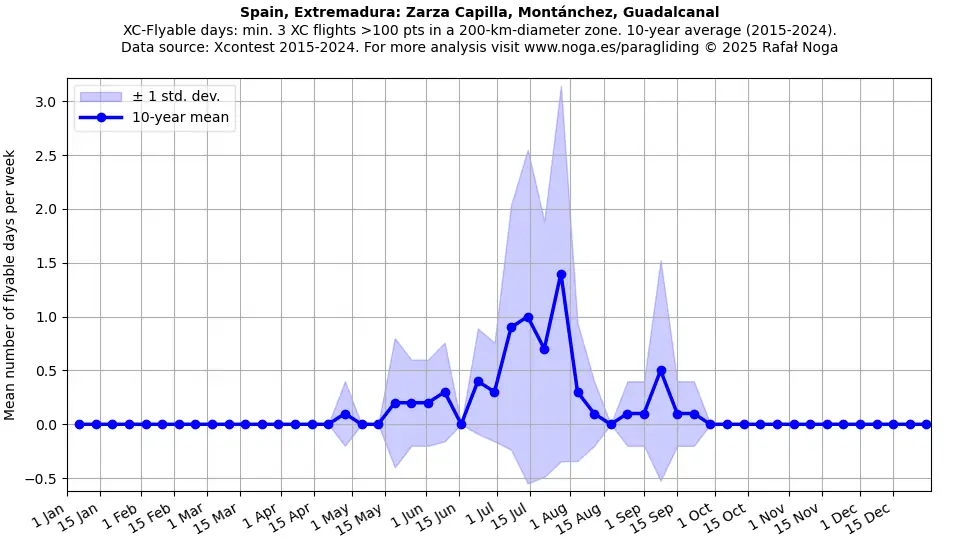
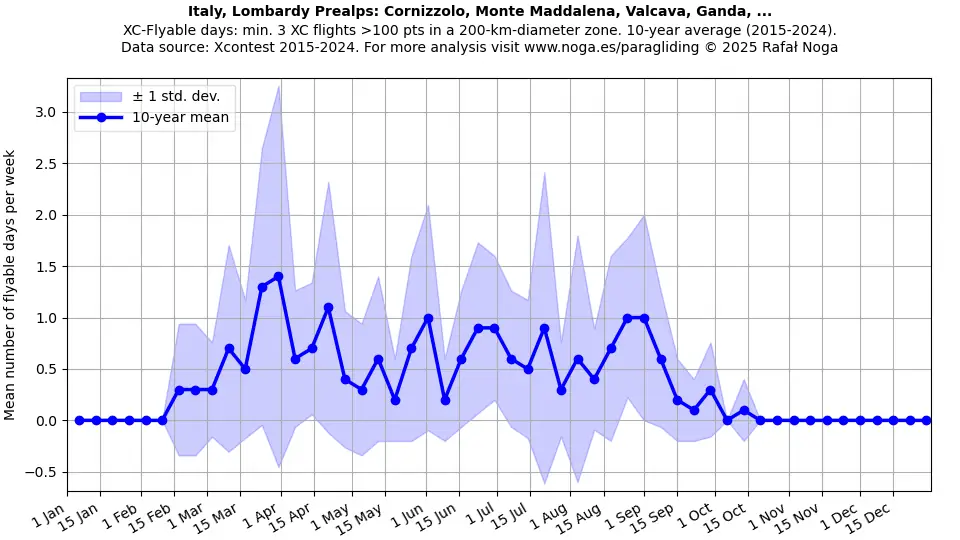
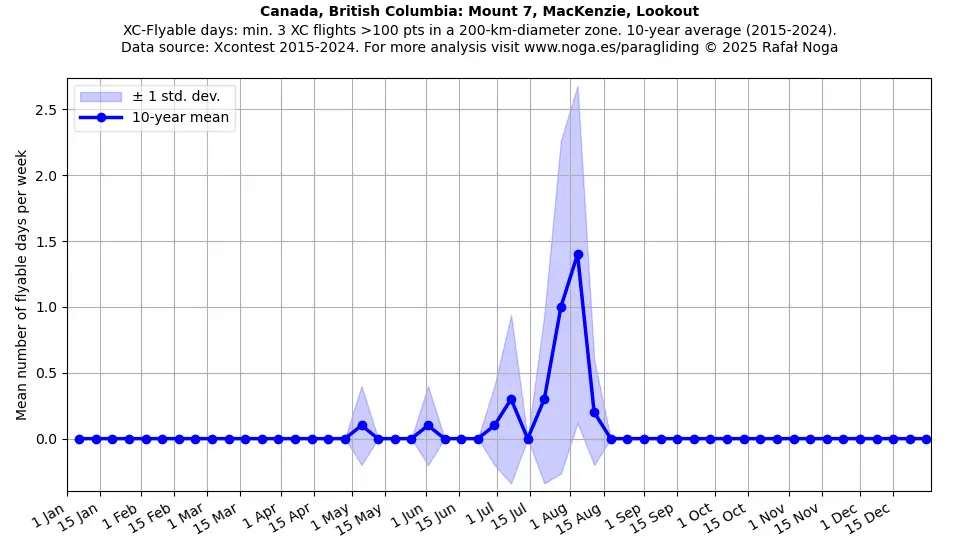
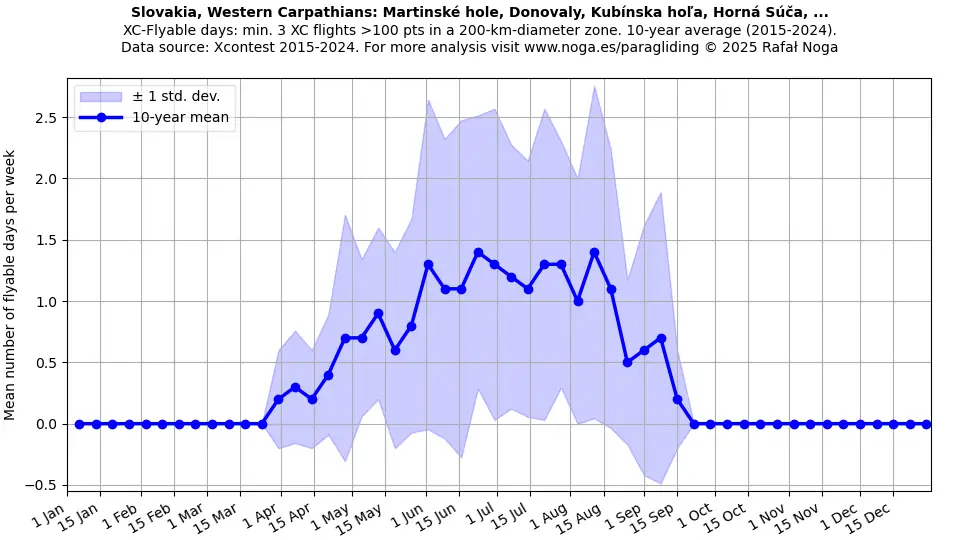
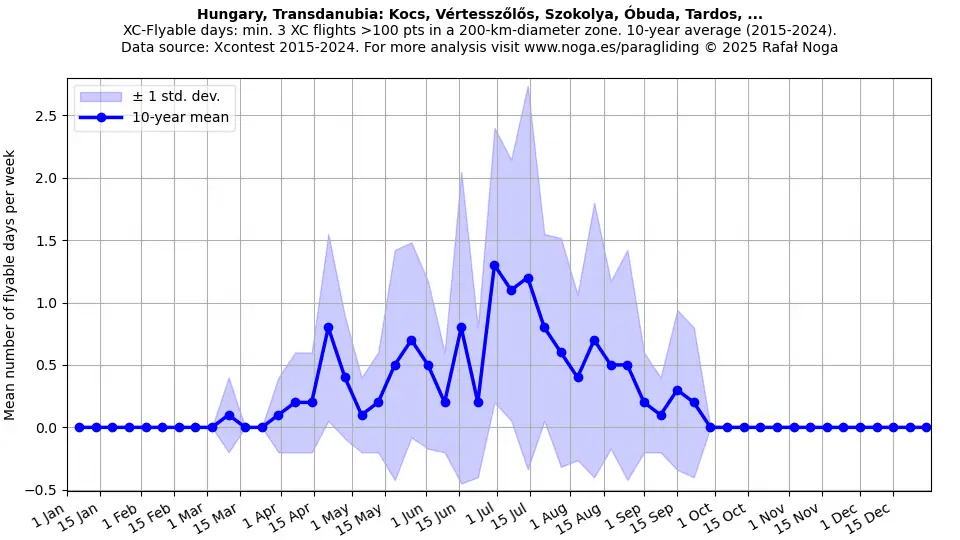
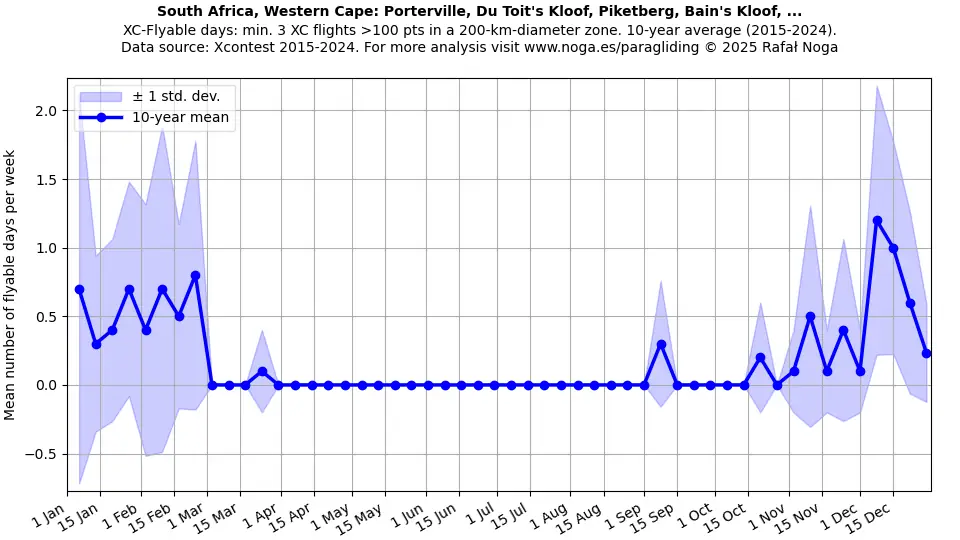
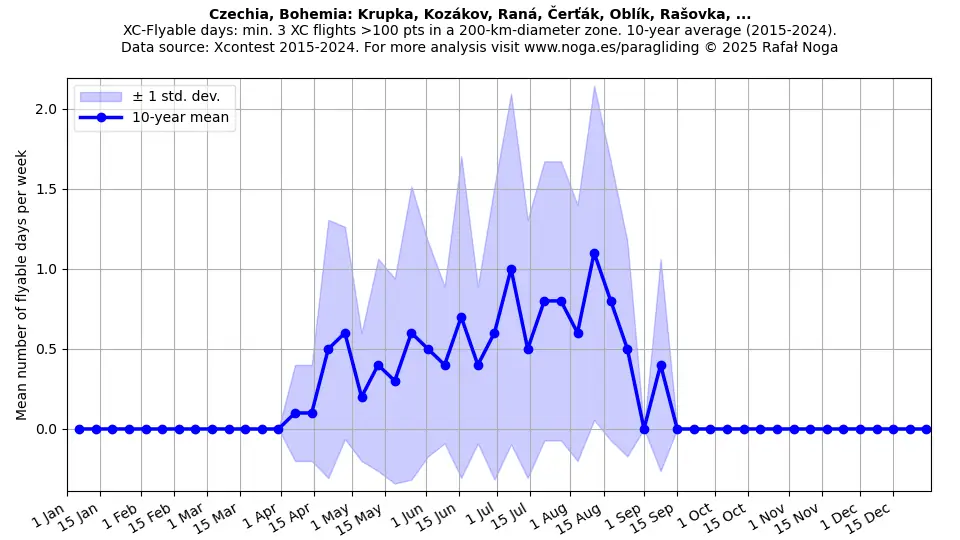
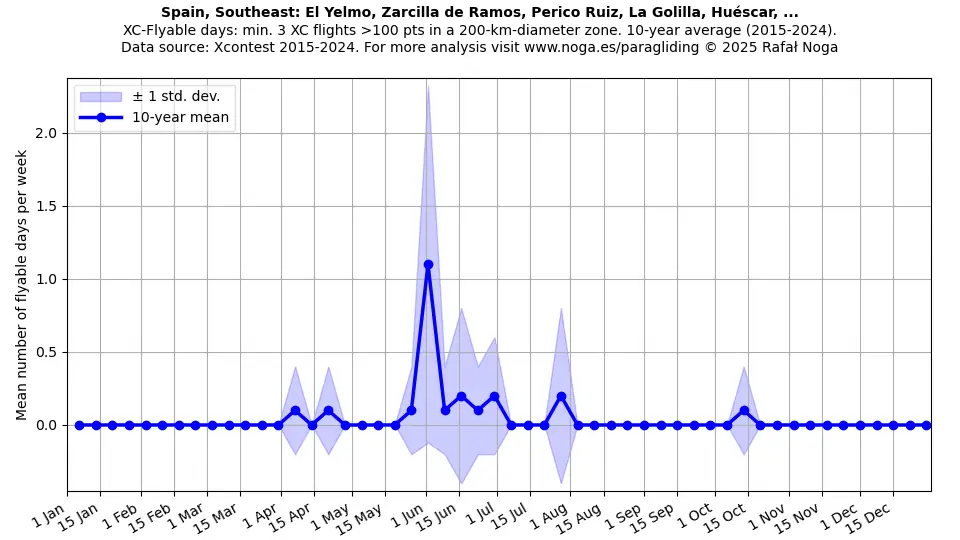
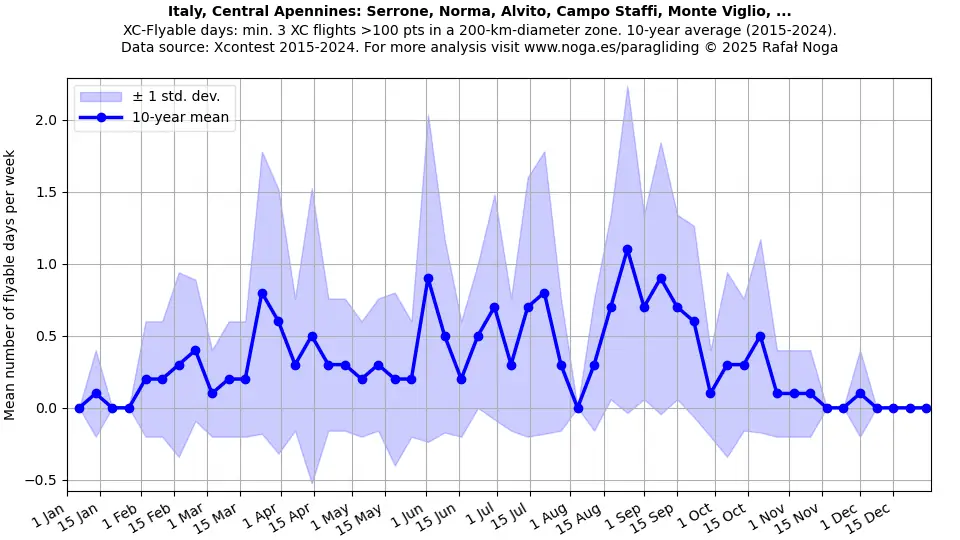
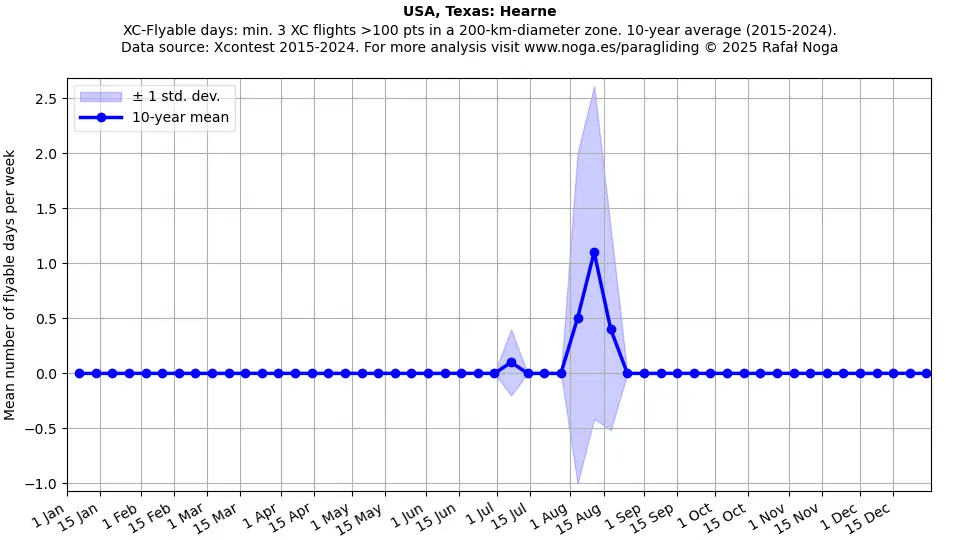
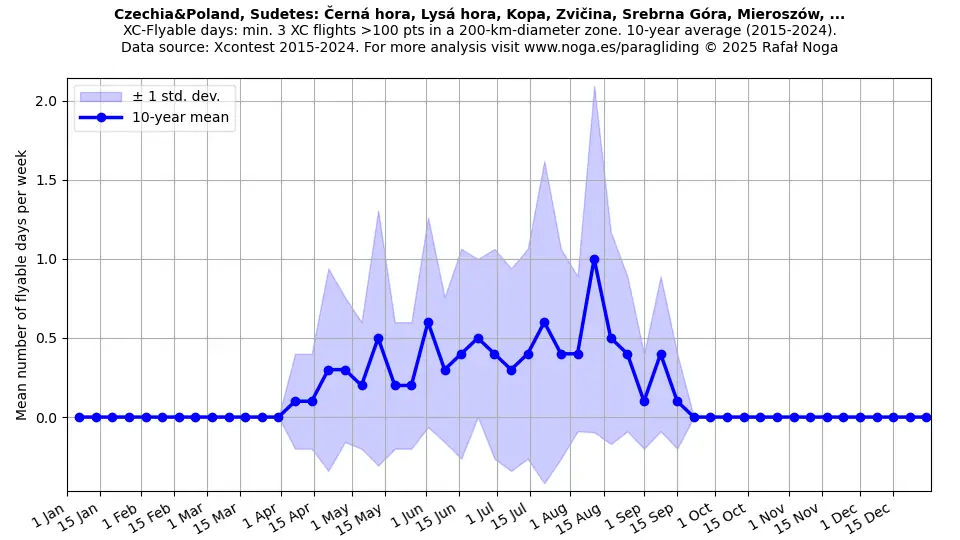
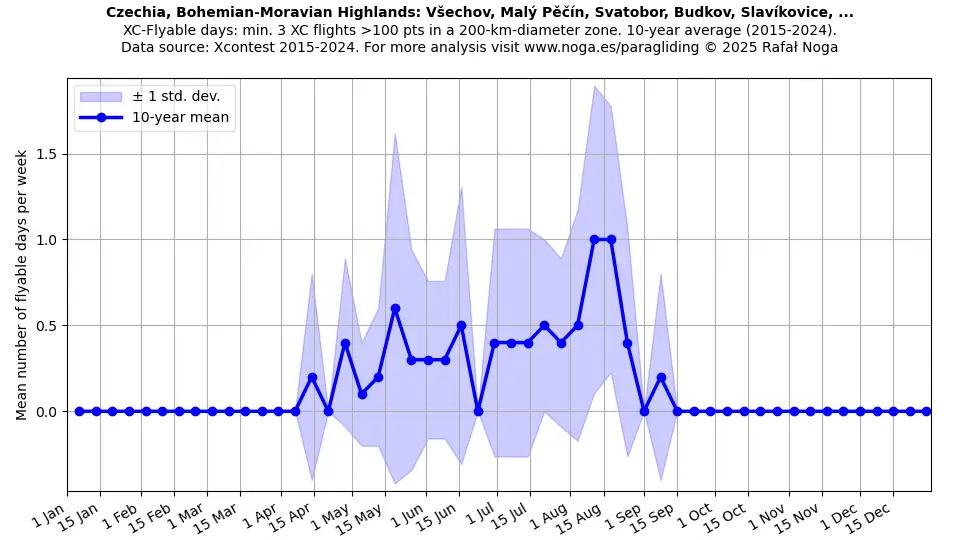
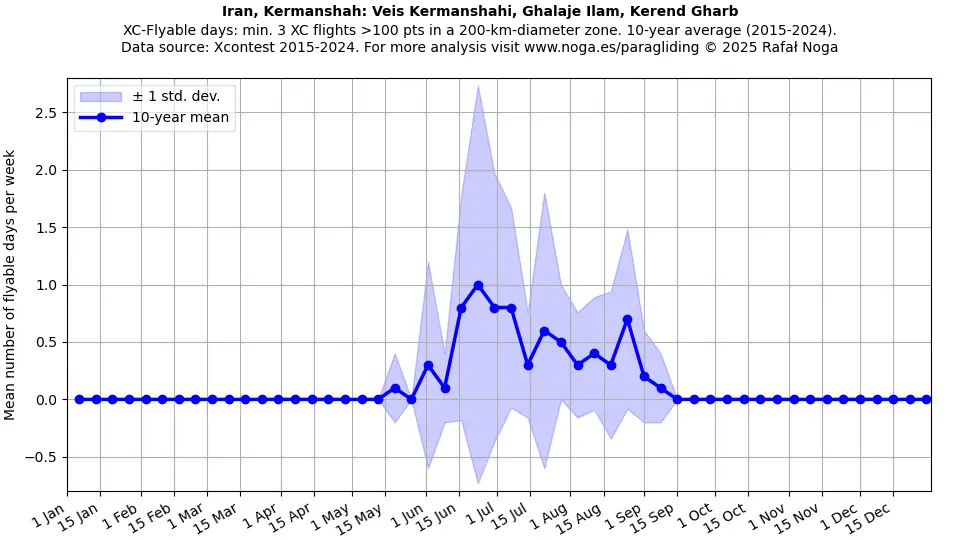
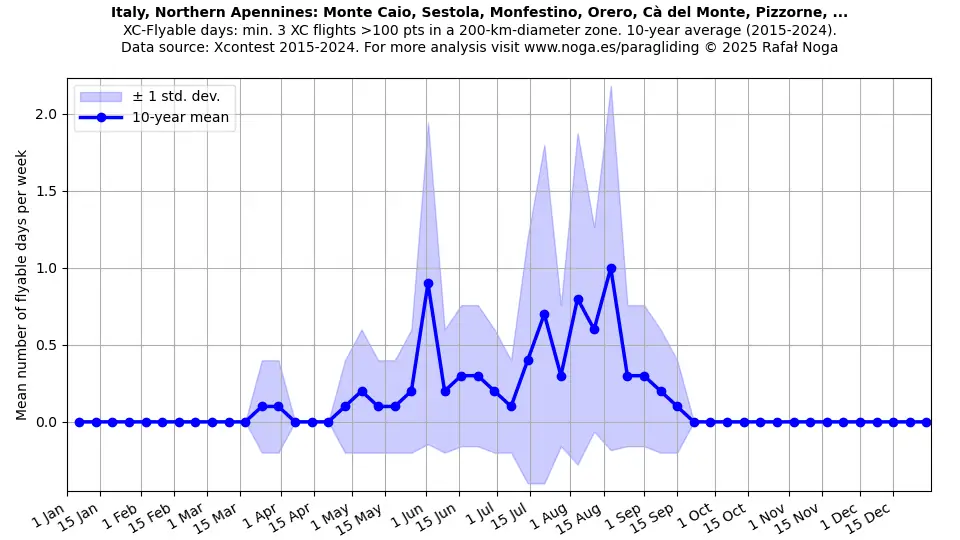
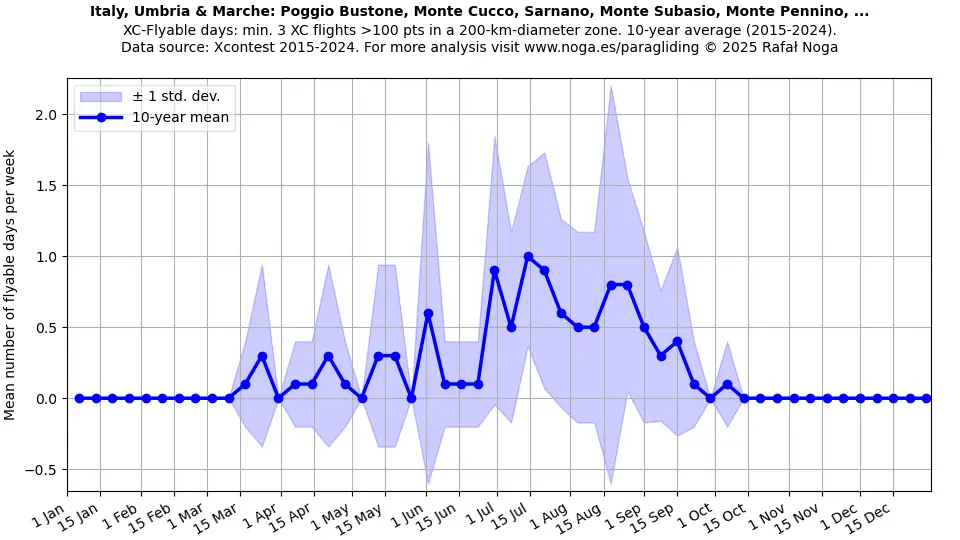
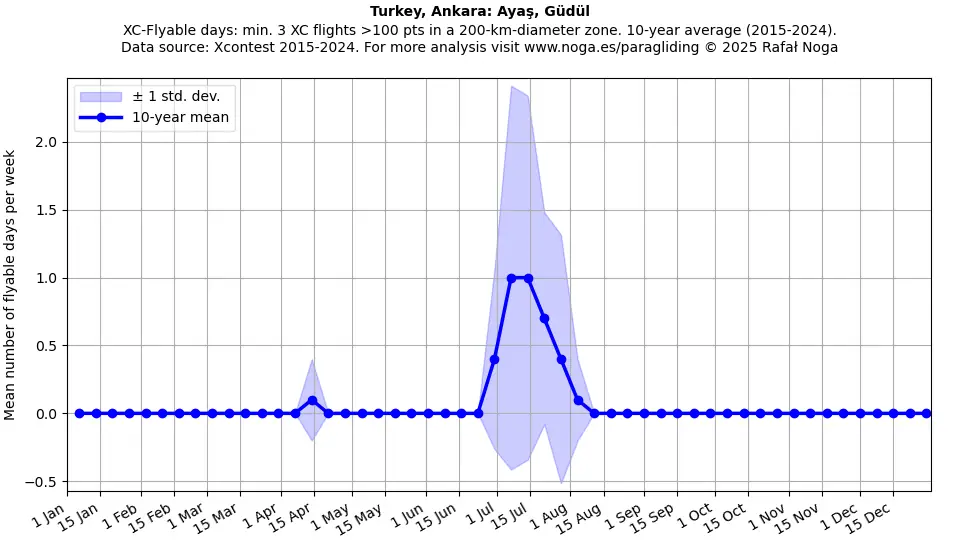
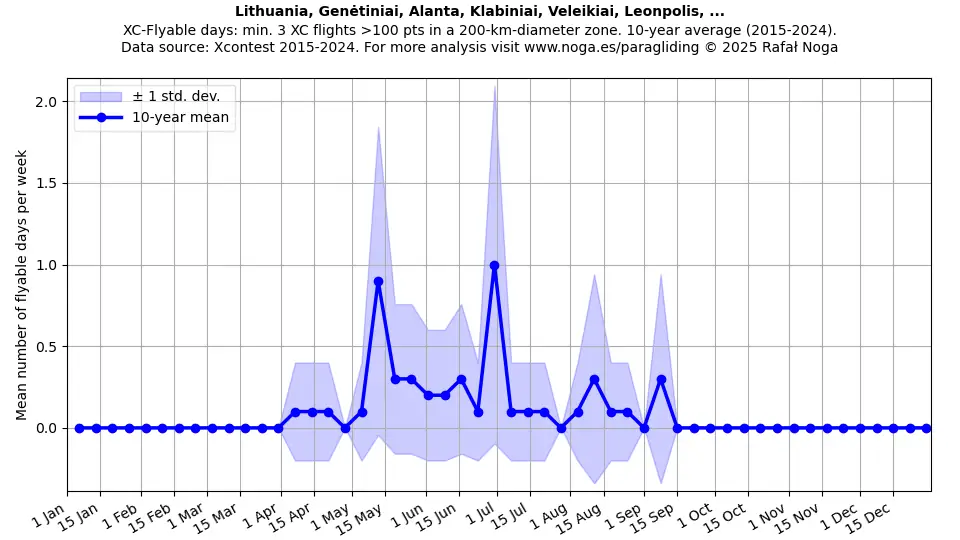
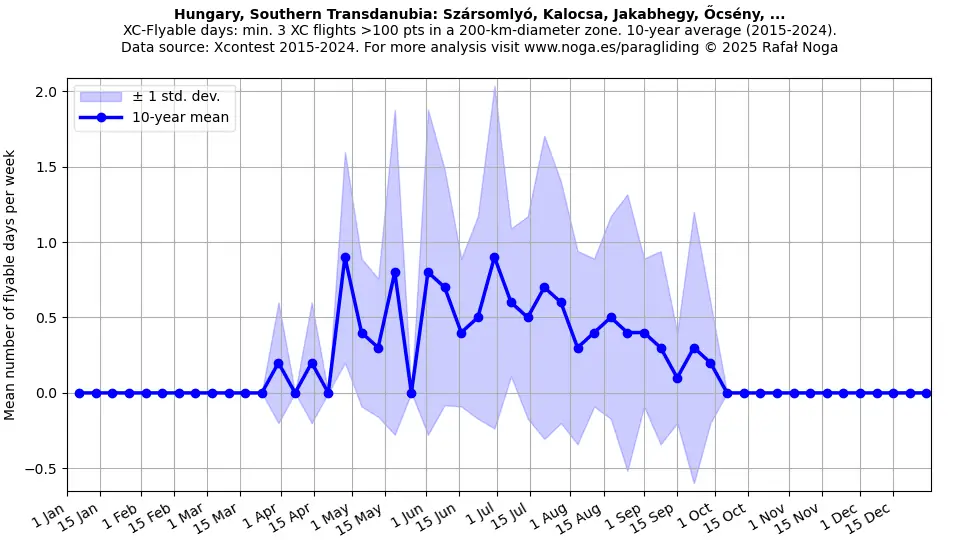
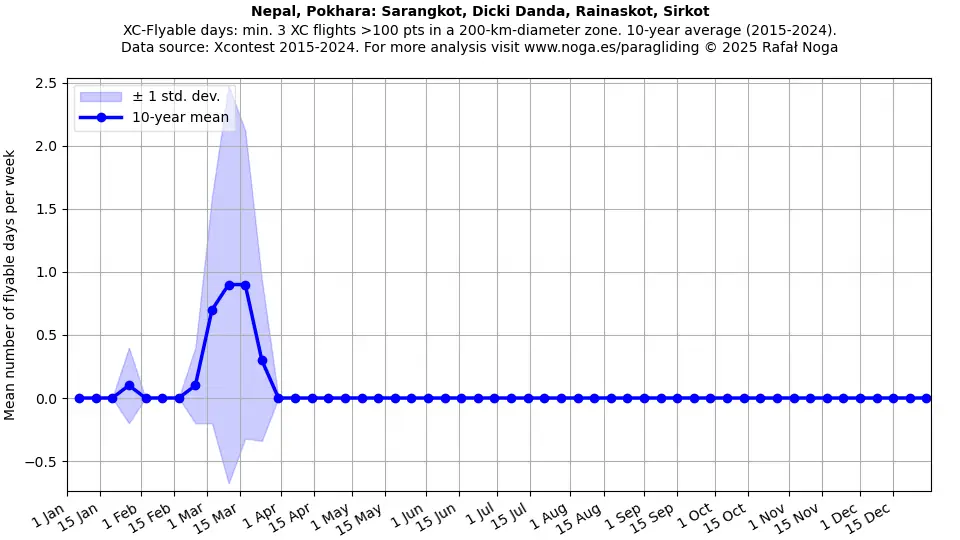
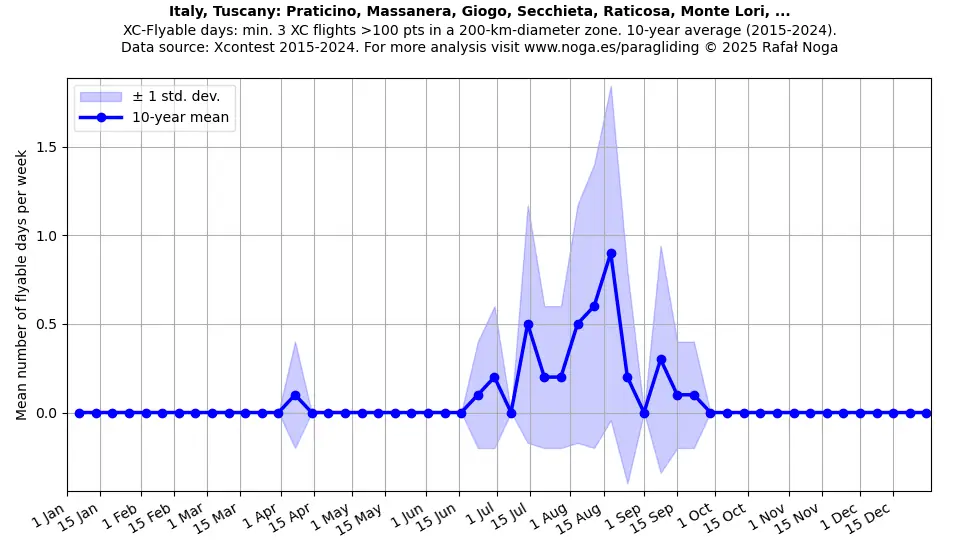
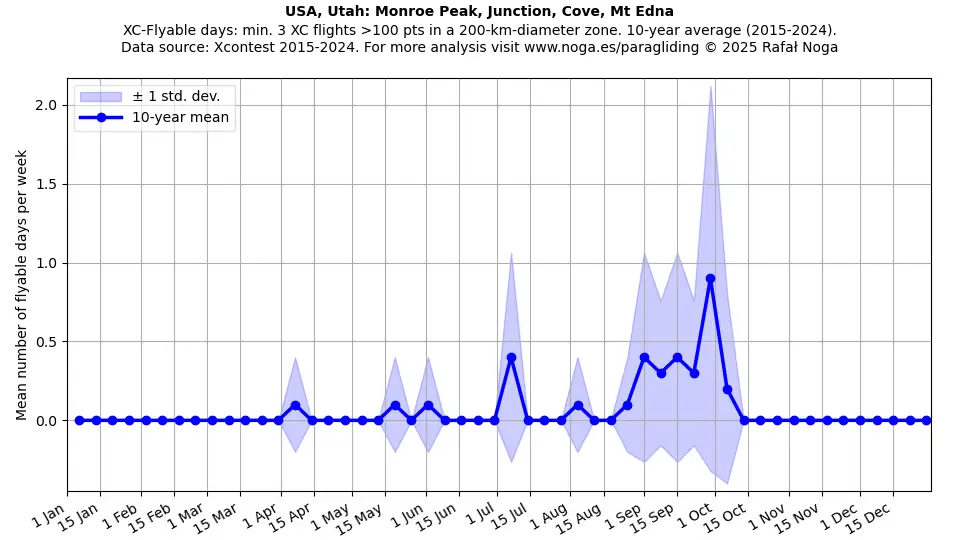
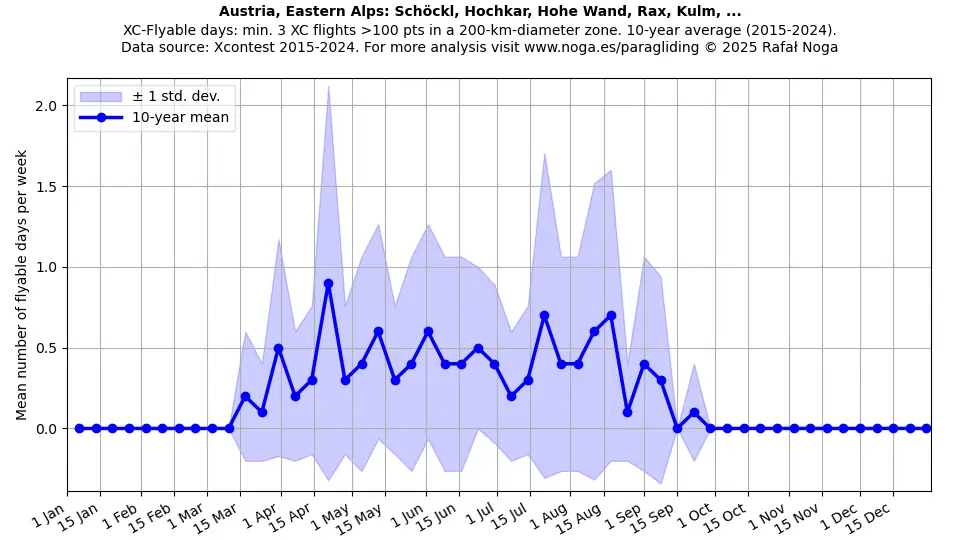
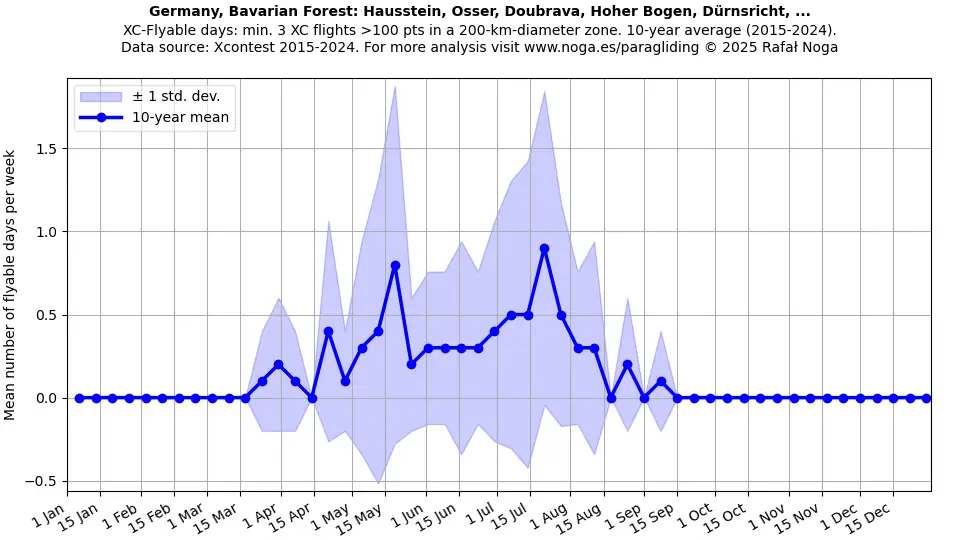
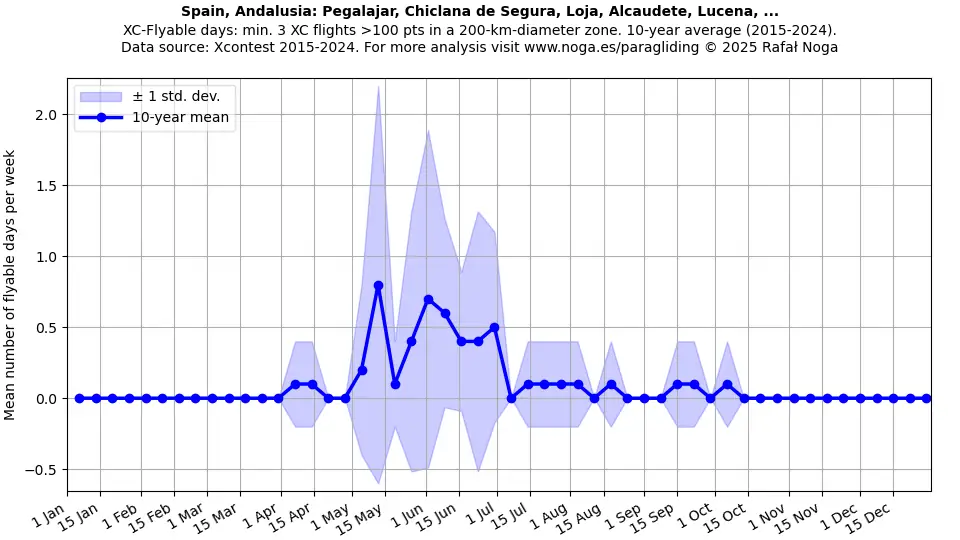
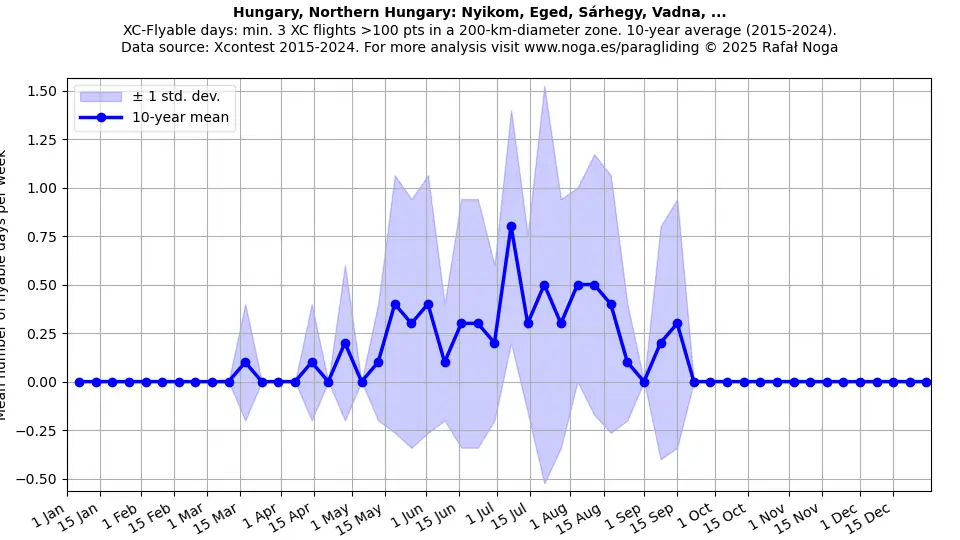
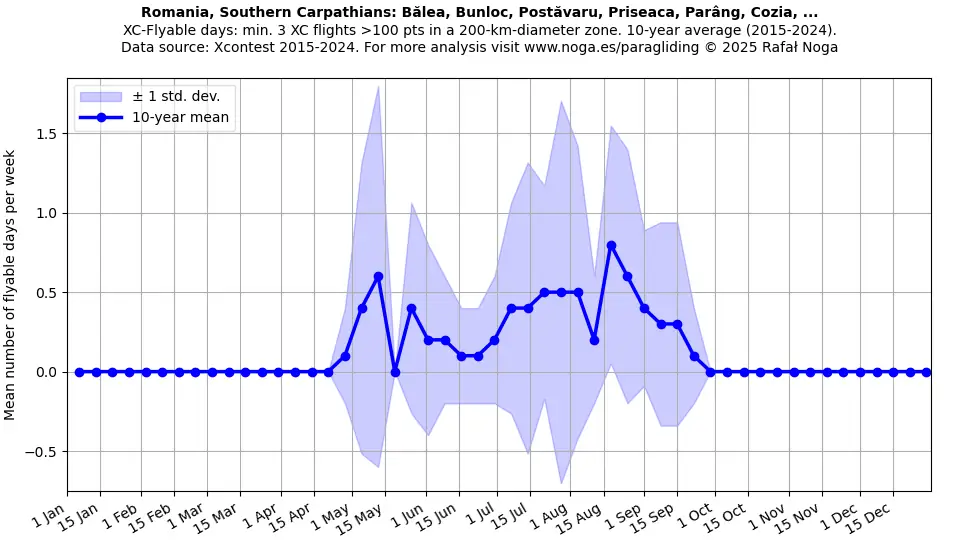
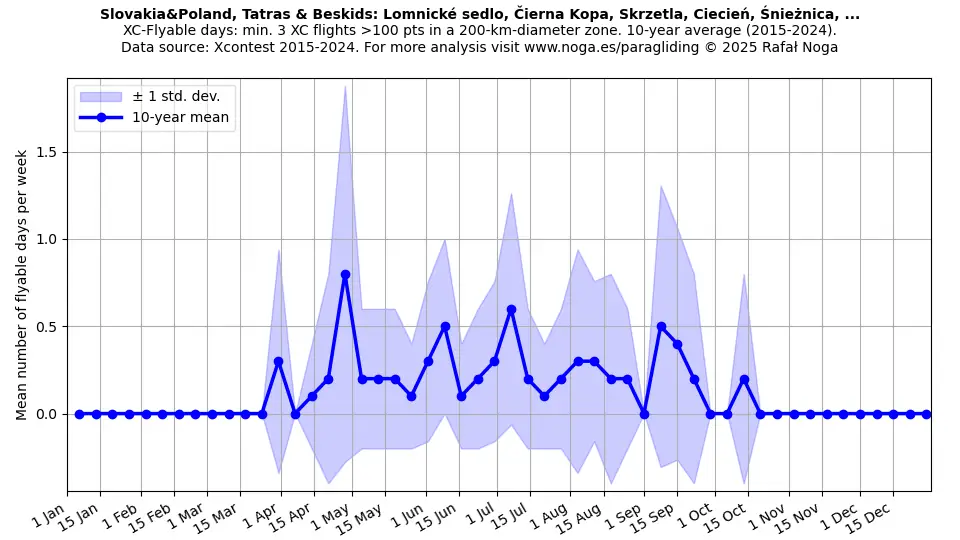
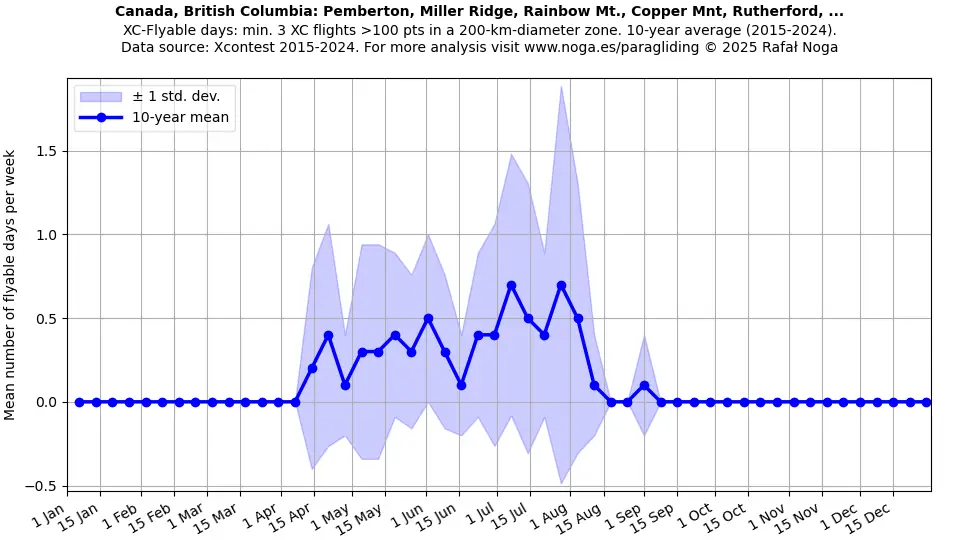
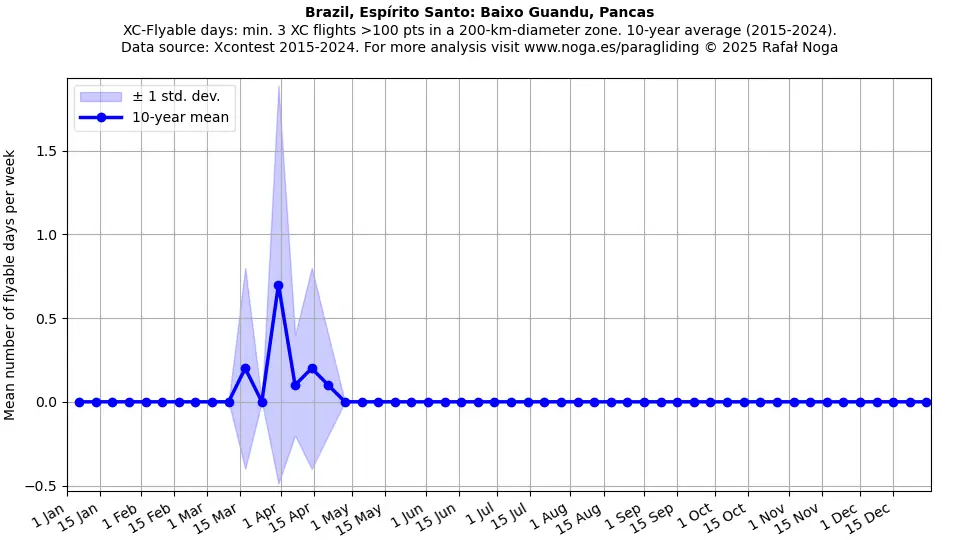
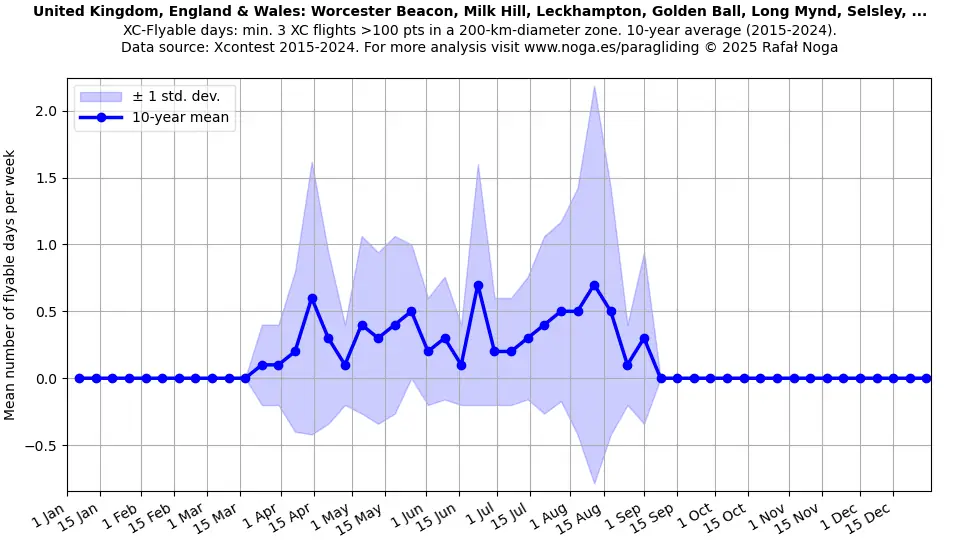
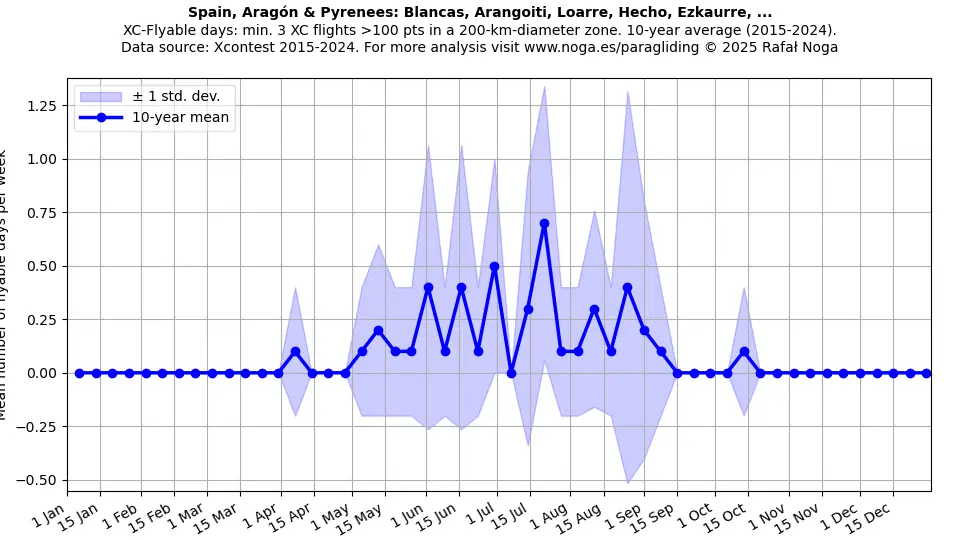
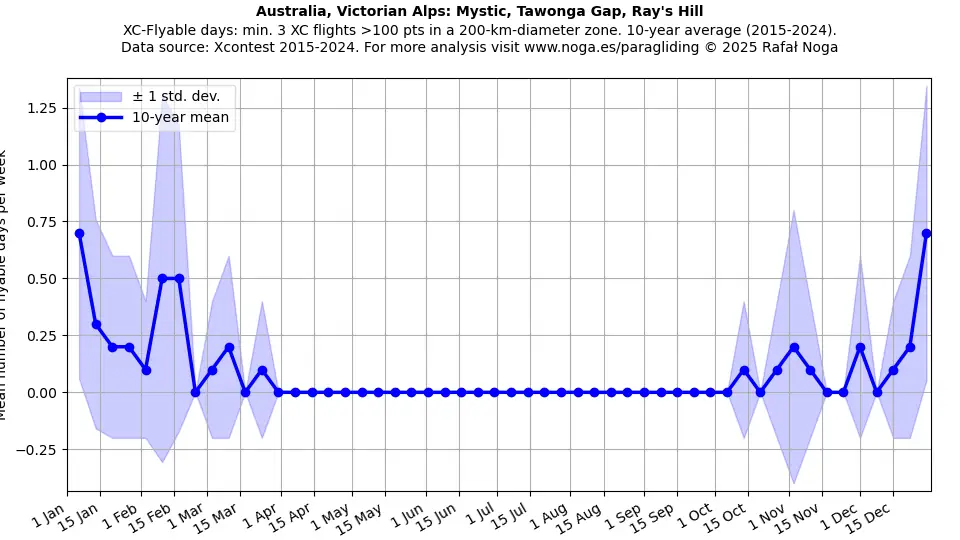
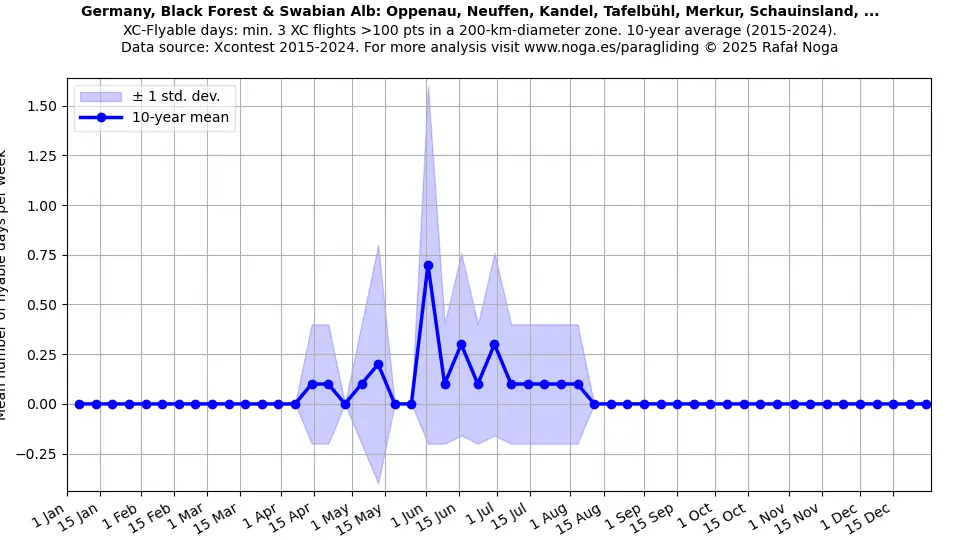
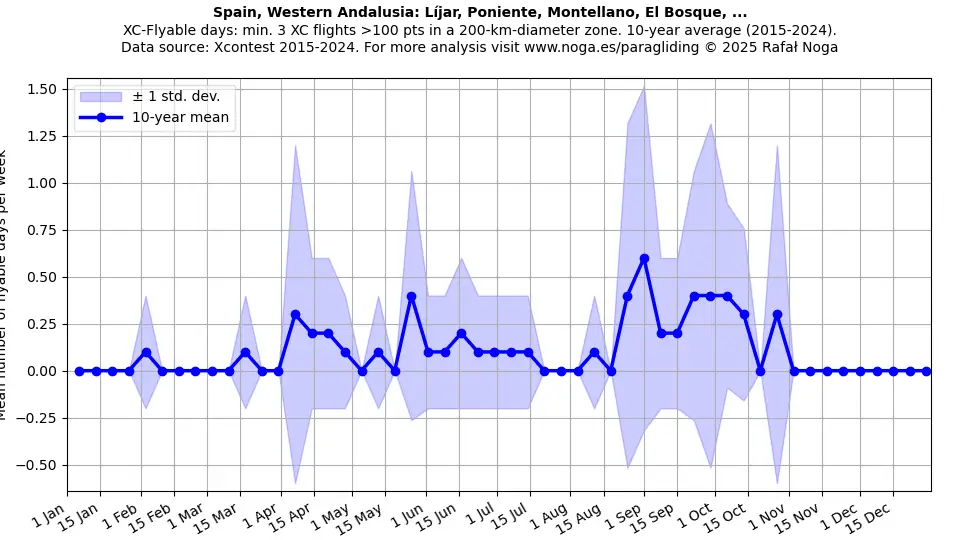
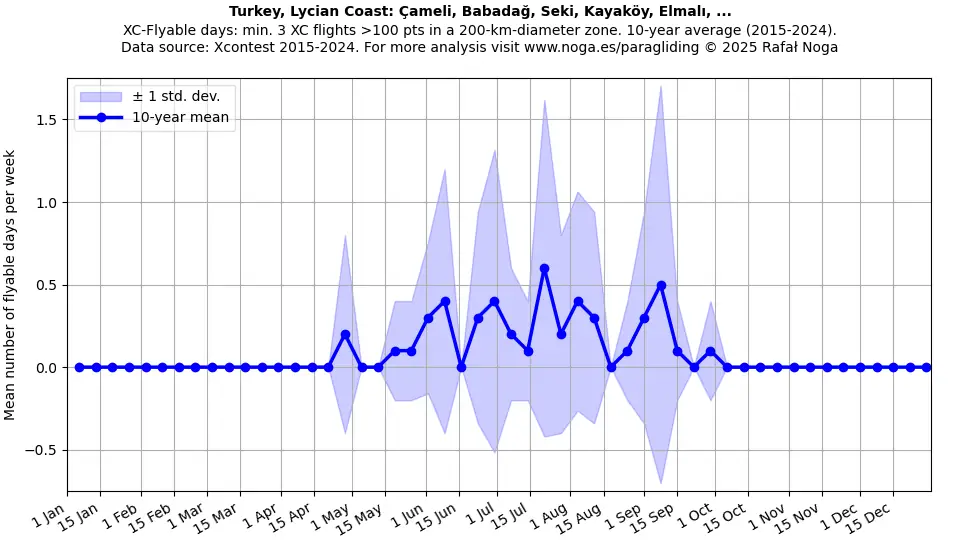
Best Regions by Season
Flyable days are defined as days with a minimum of 3 flights, each scoring over 100 points and registered within a 200-km-diameter zone. Averages are computed across 11 years. Data source: Xcontest 2015–2025.
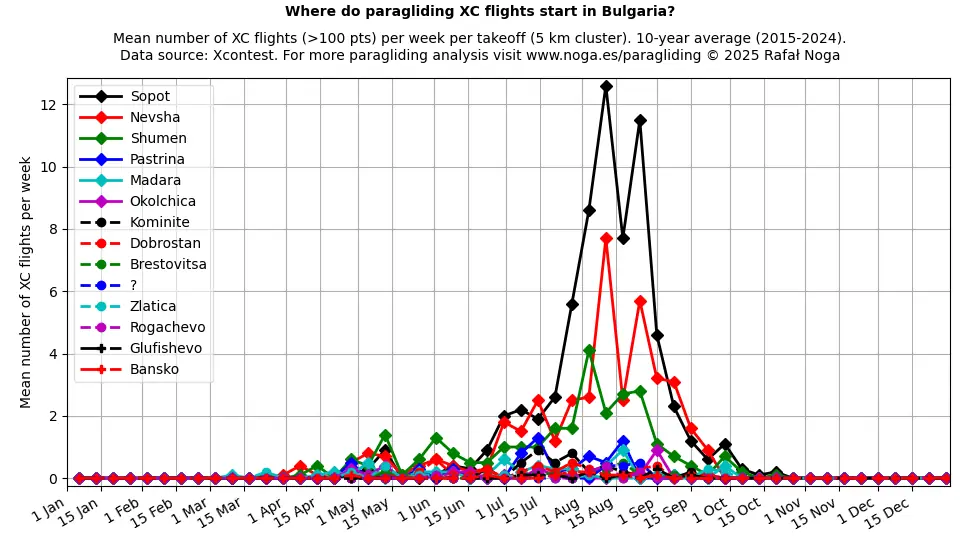
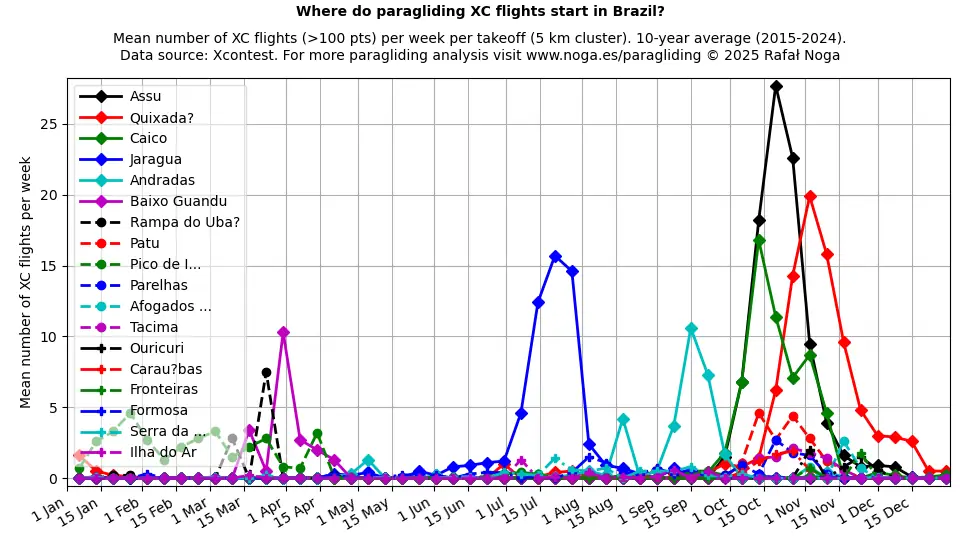
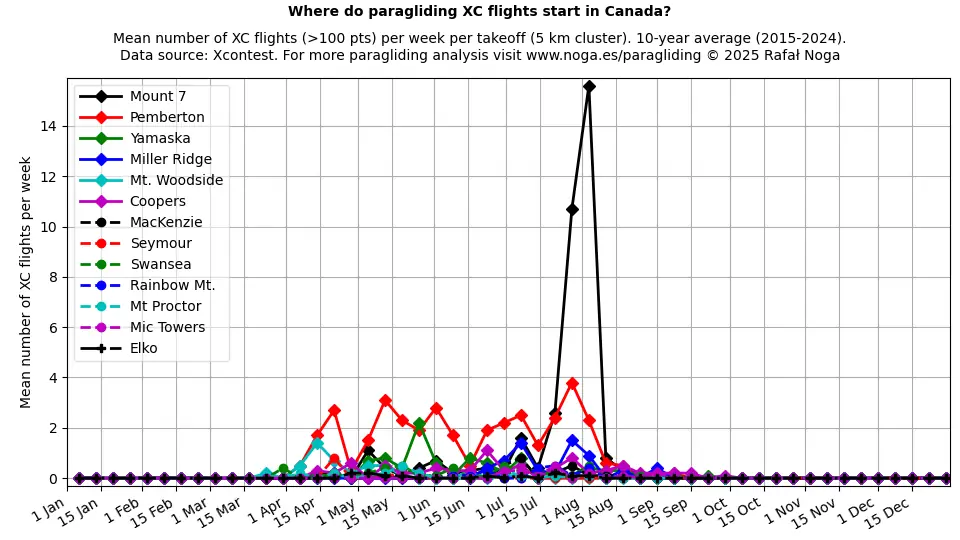
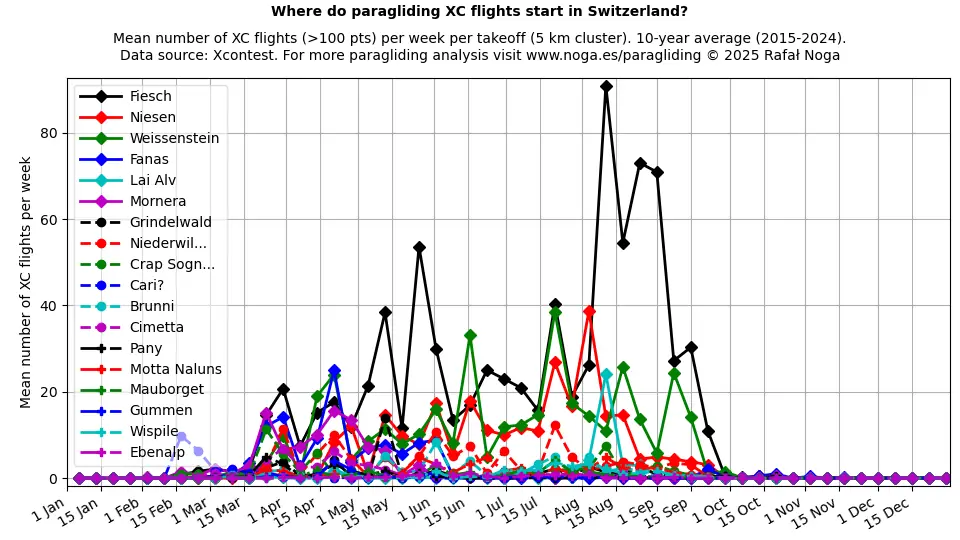
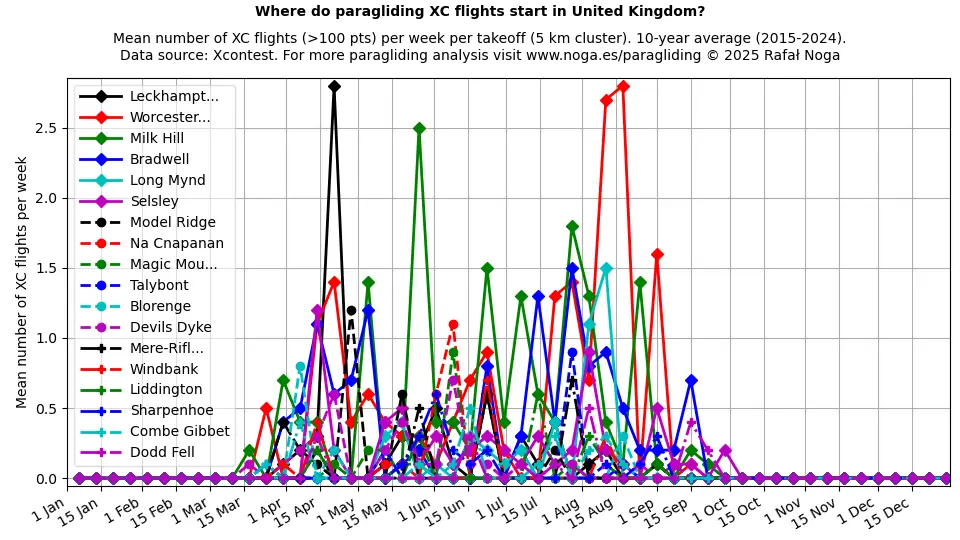
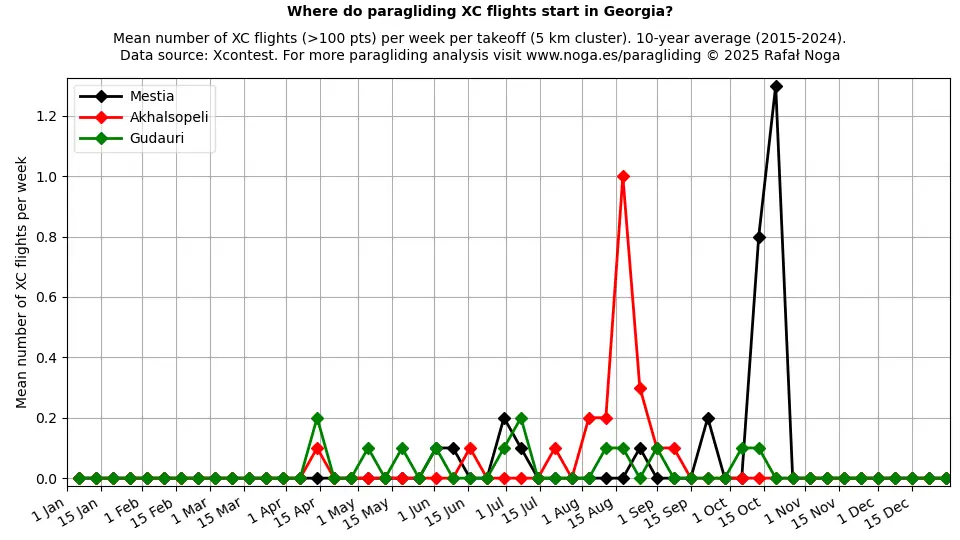
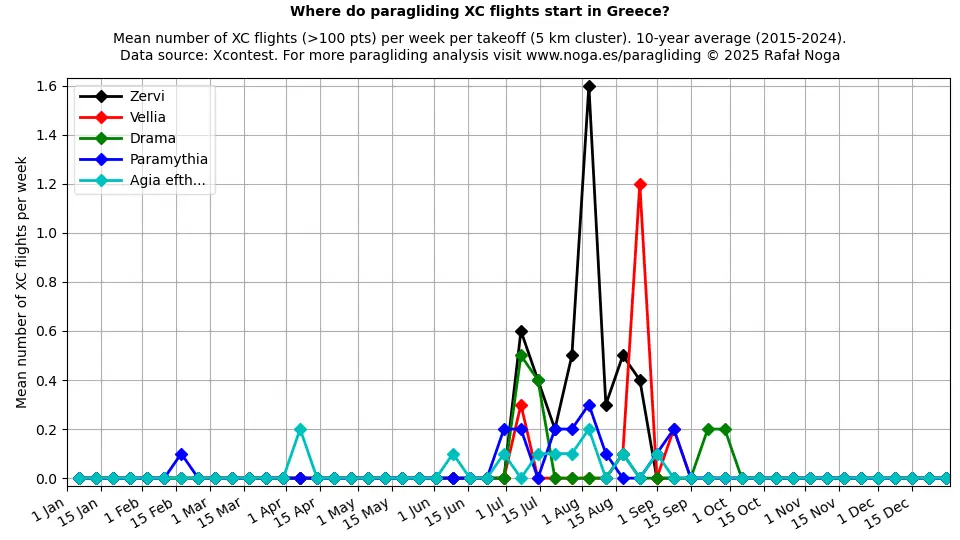
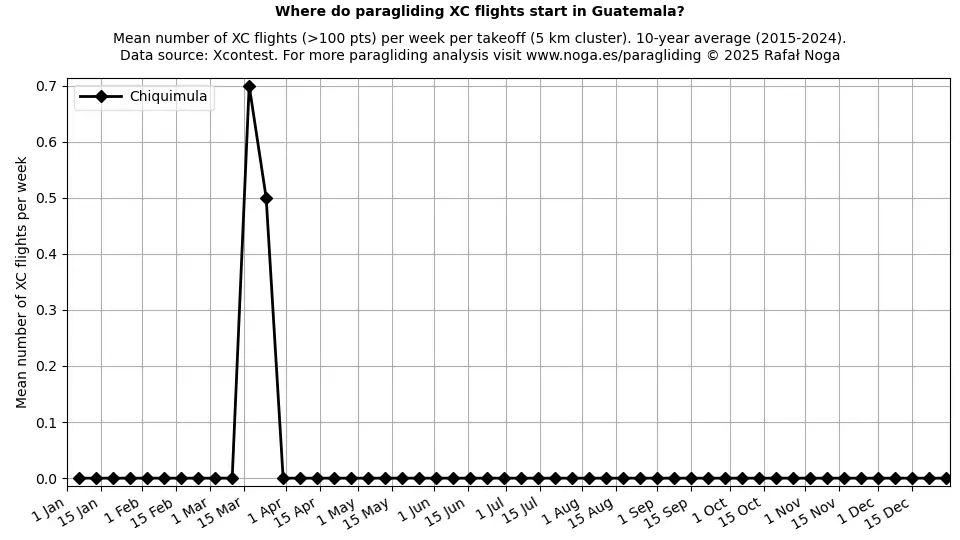
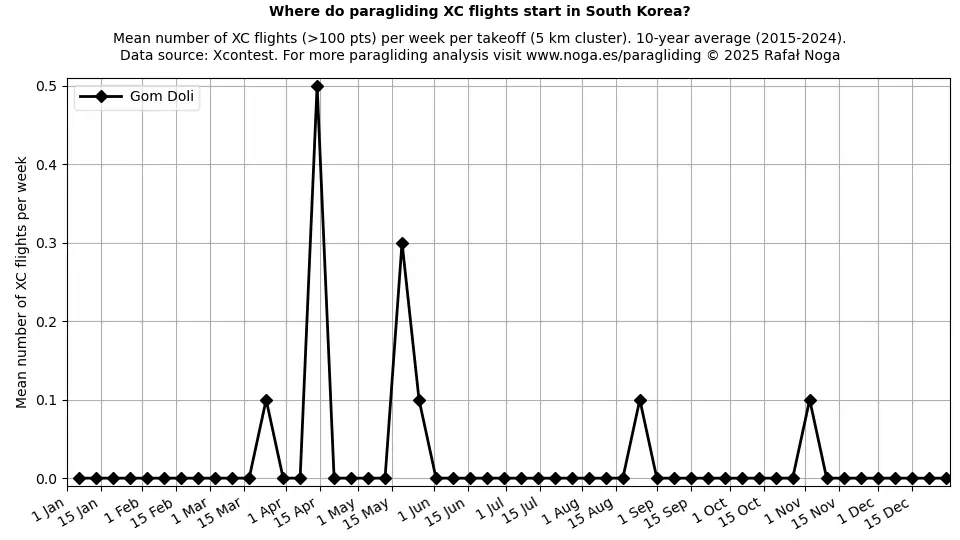
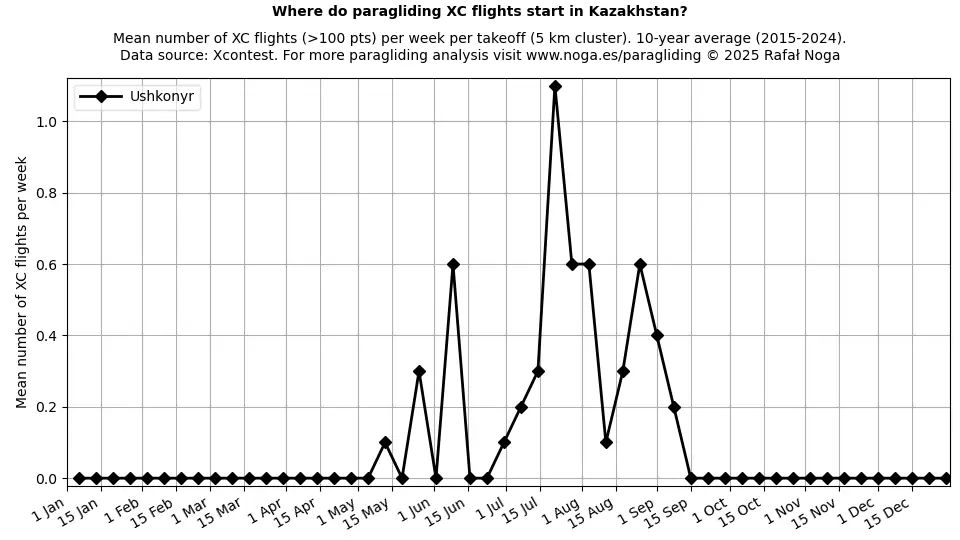
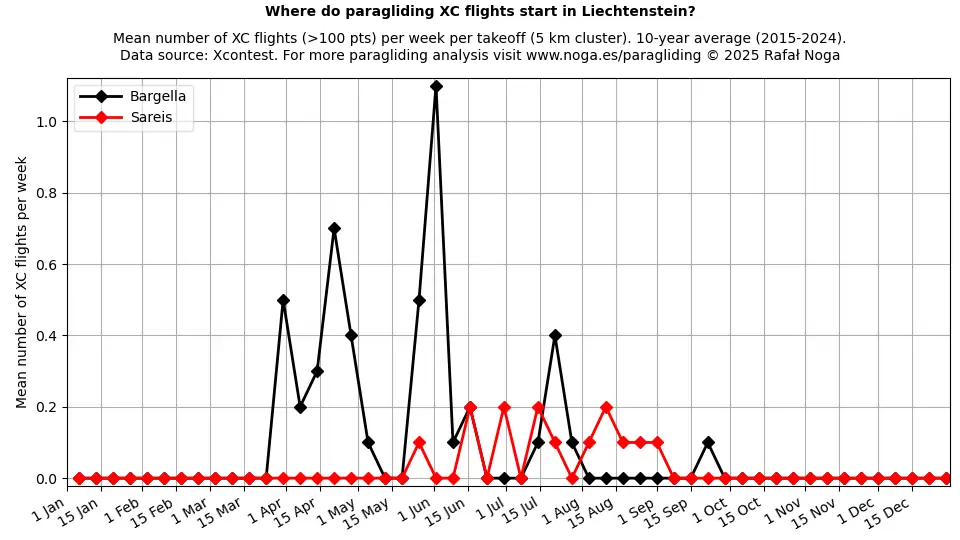
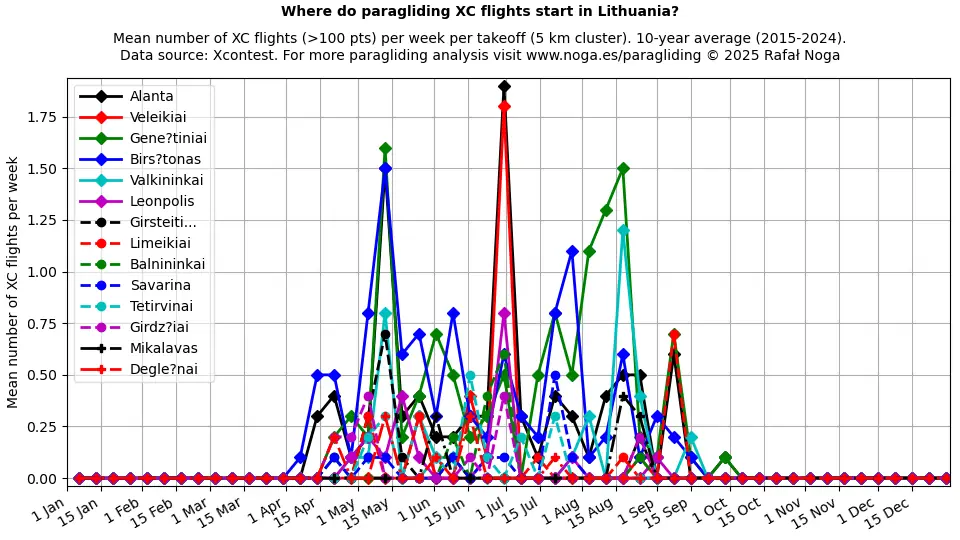
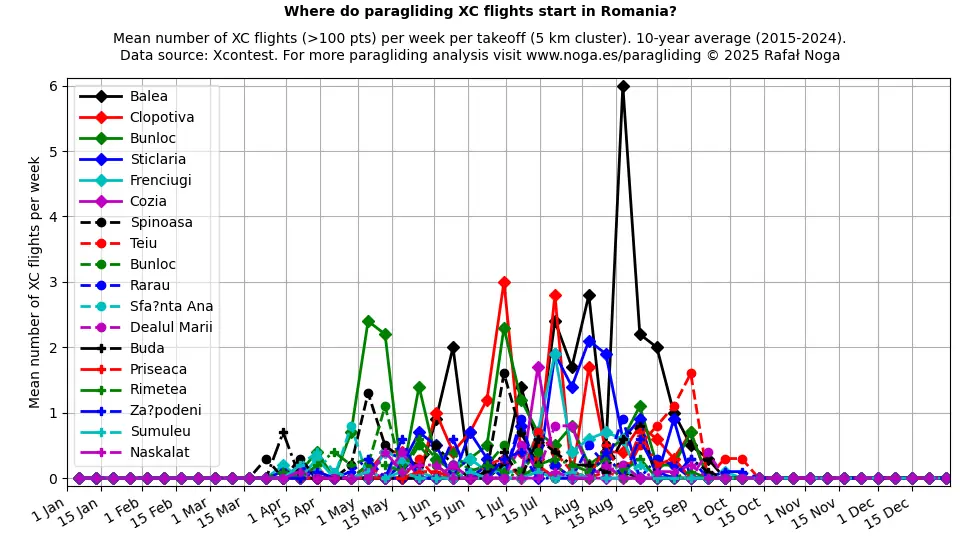
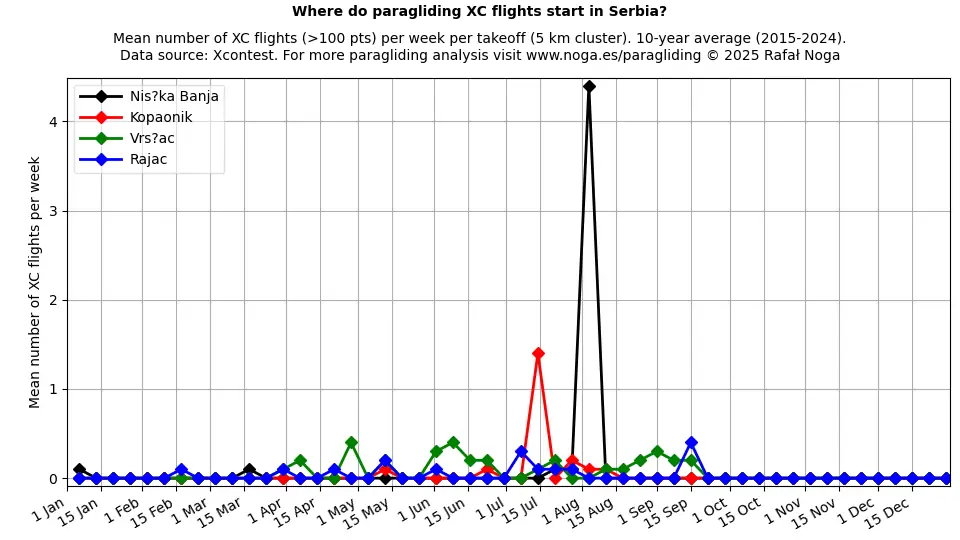
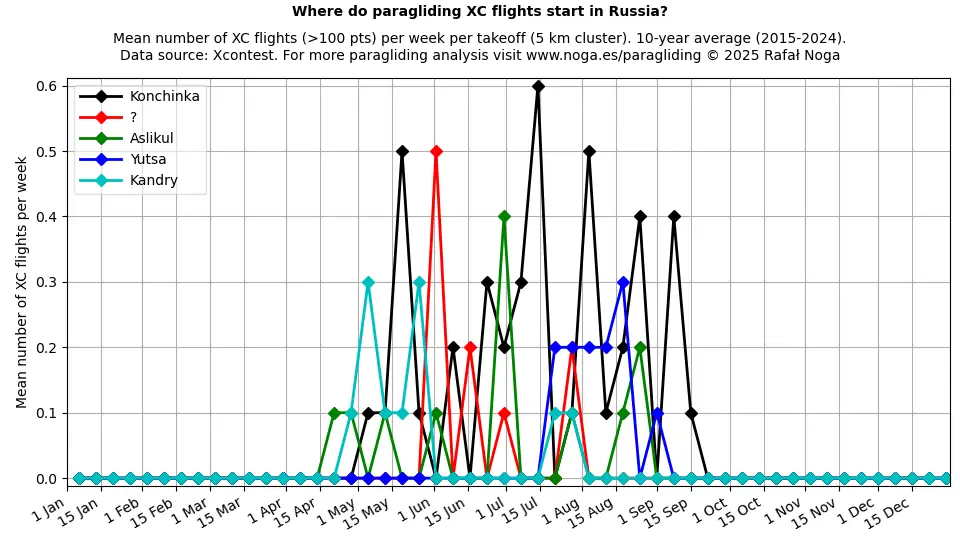
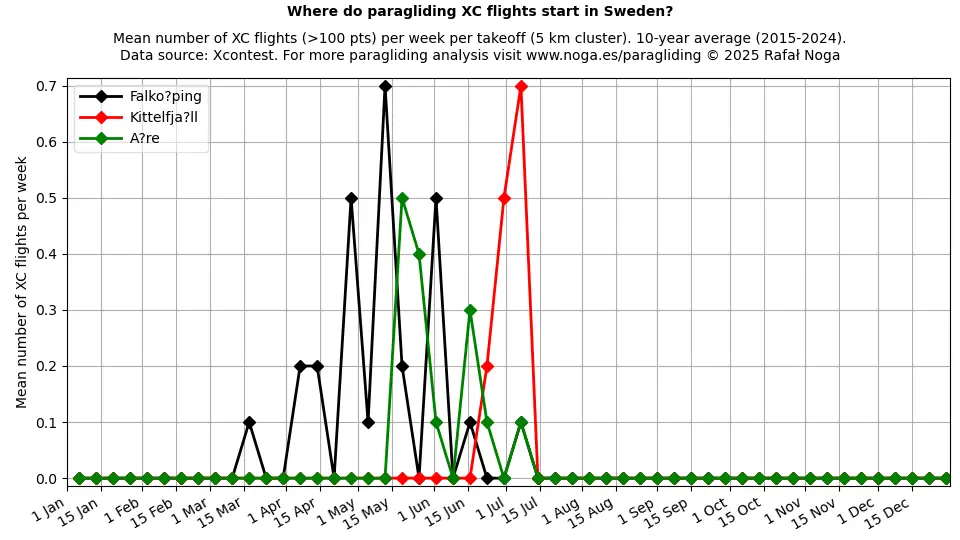
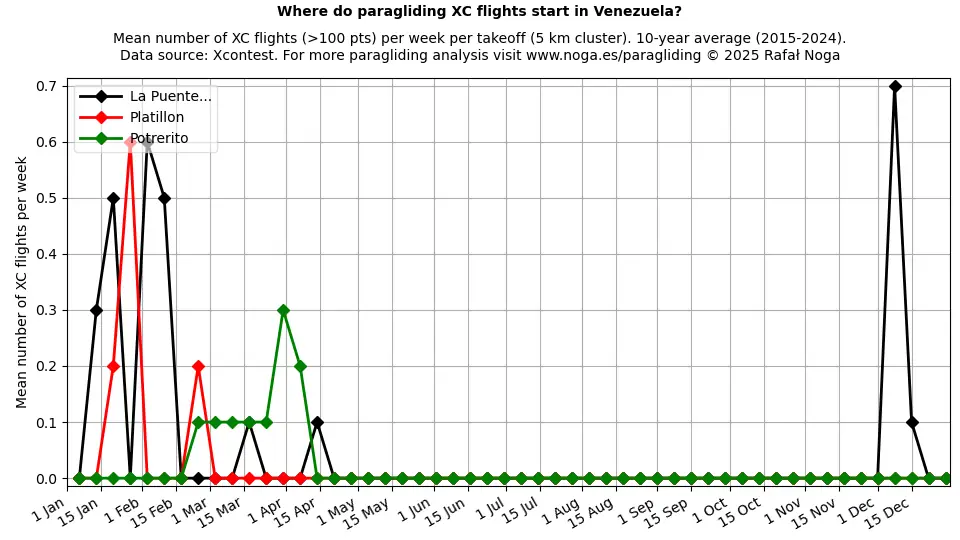
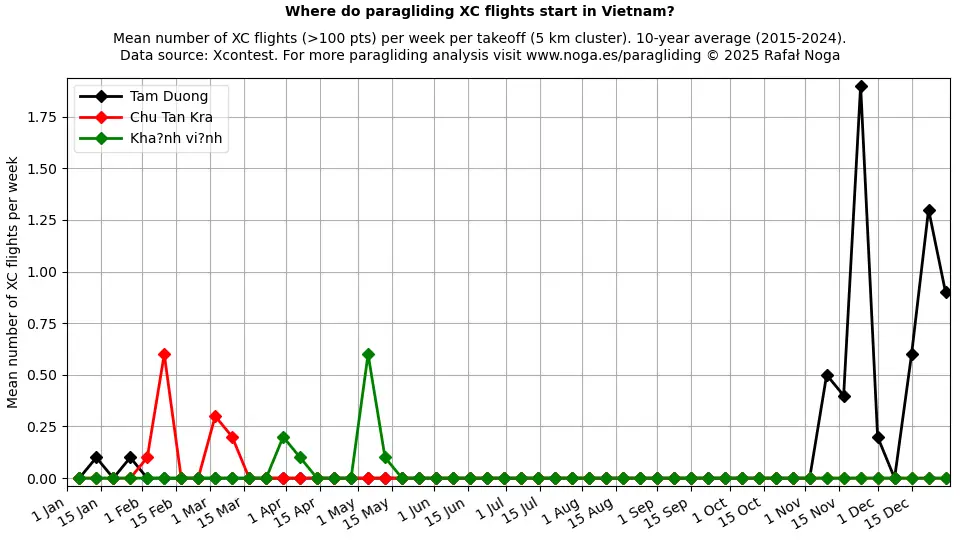
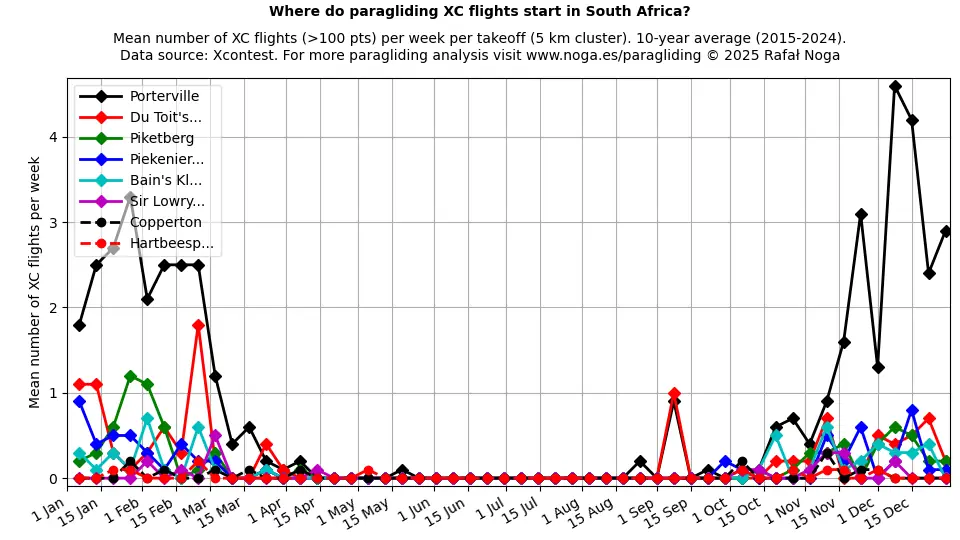
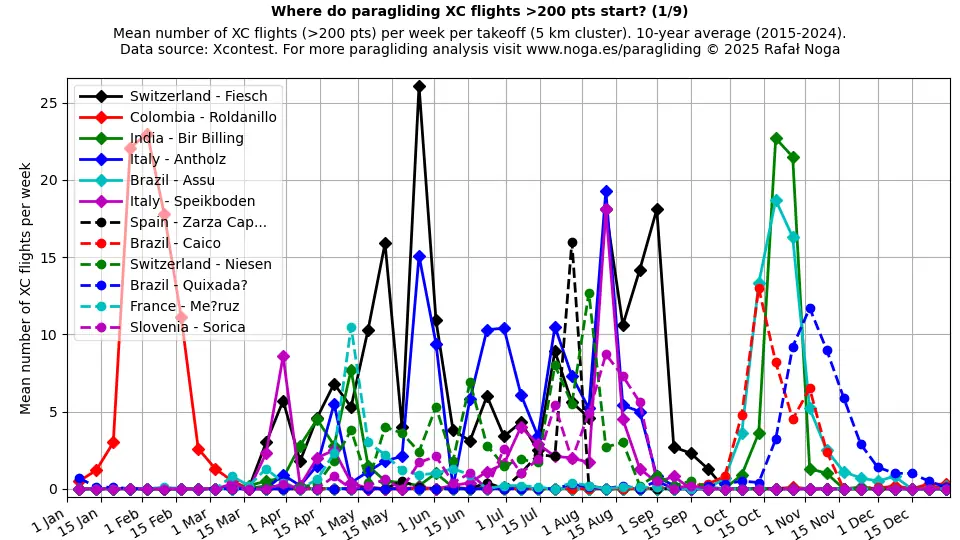
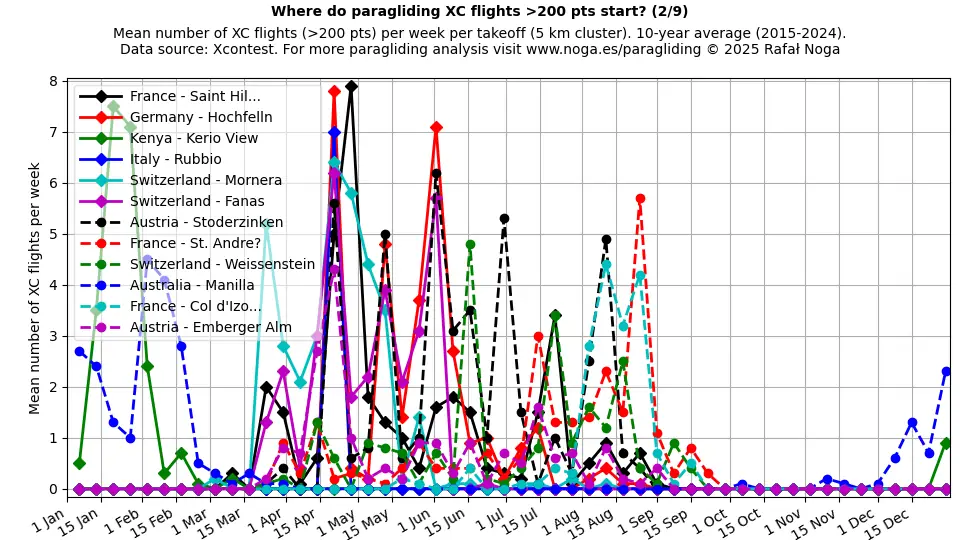
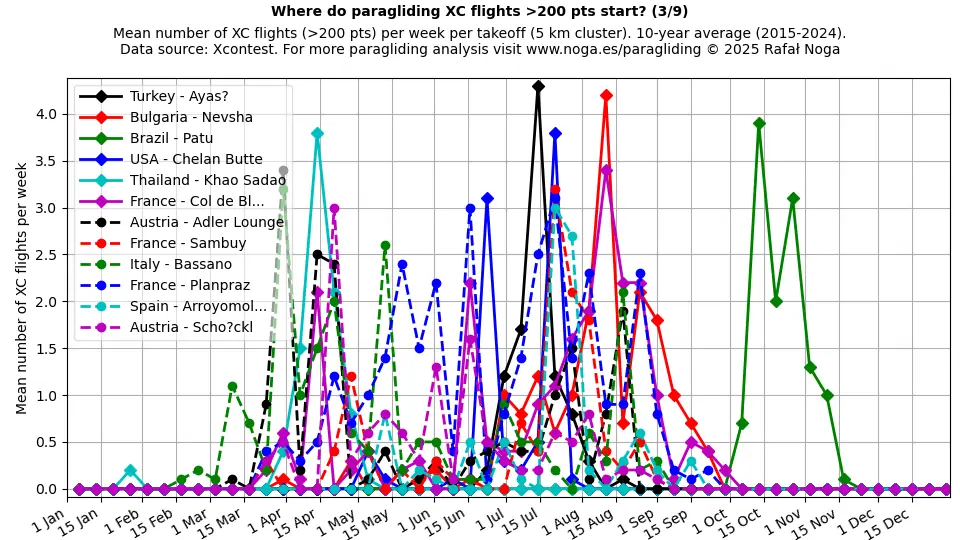
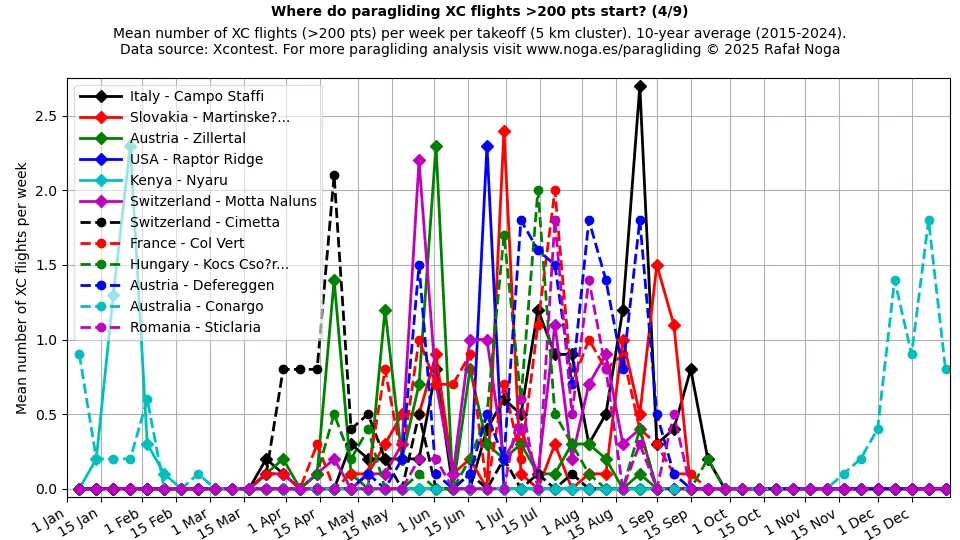
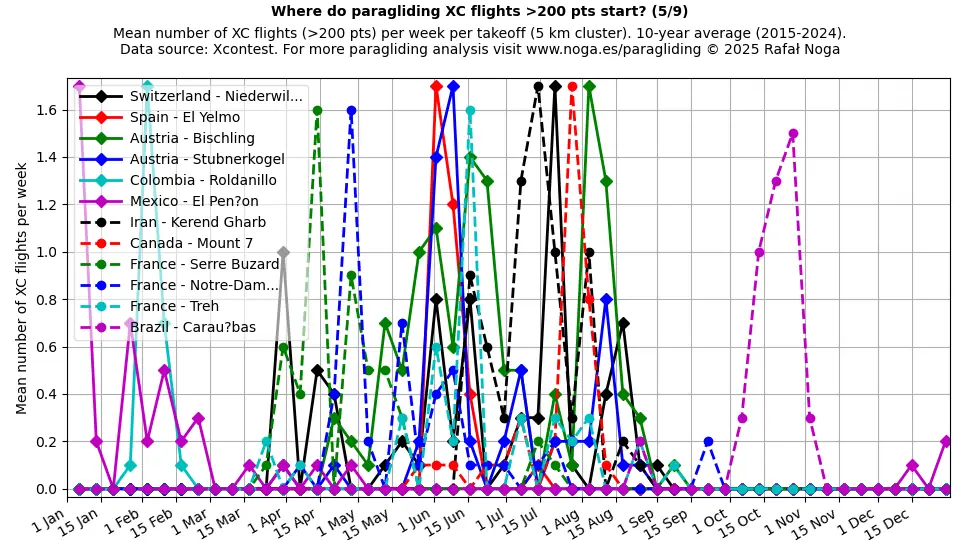
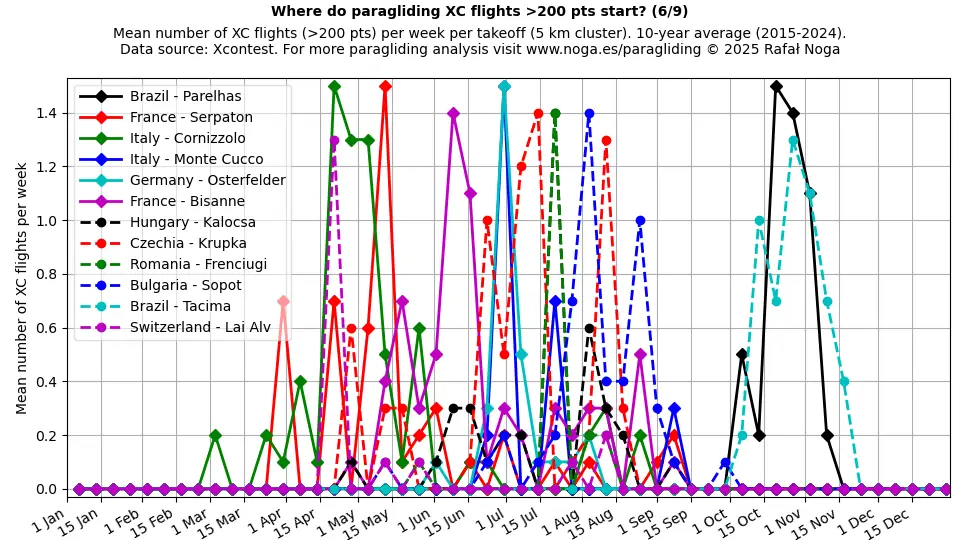
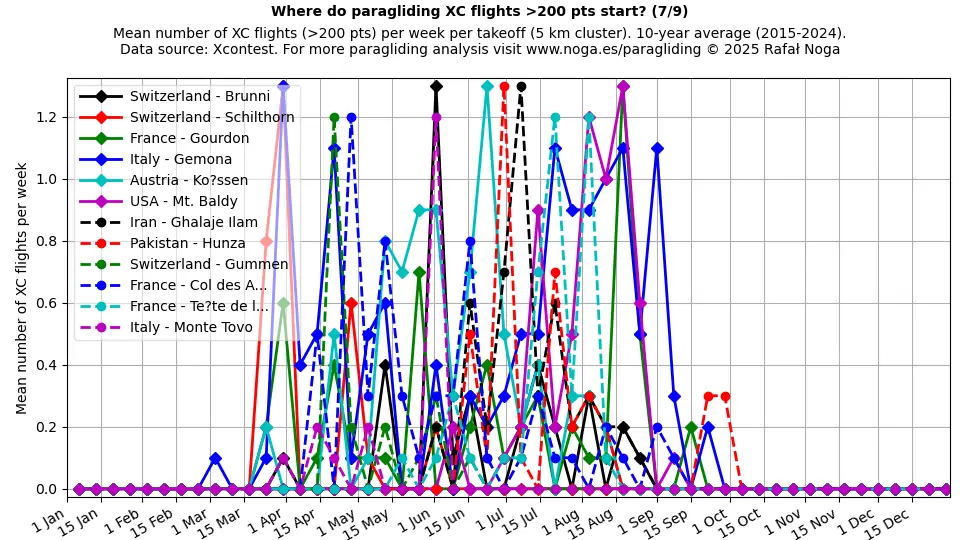
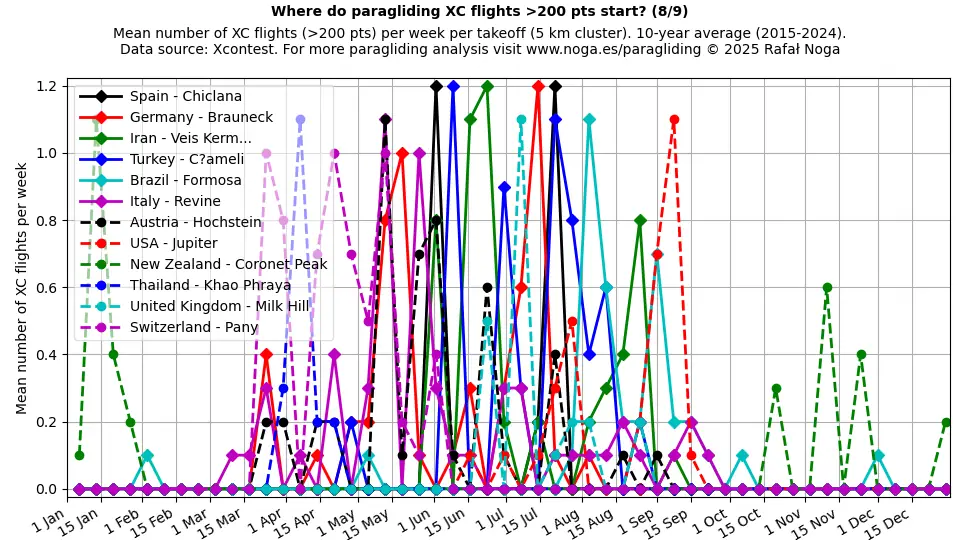
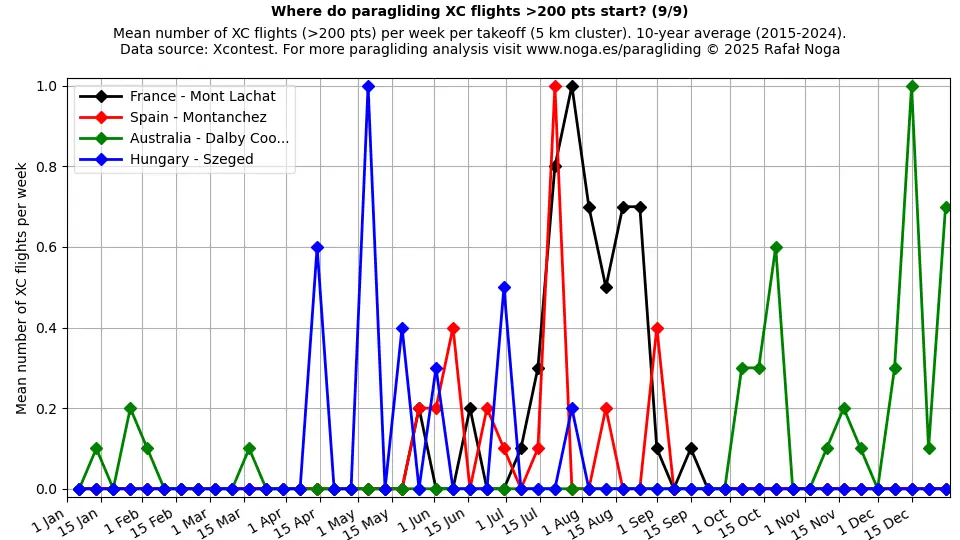
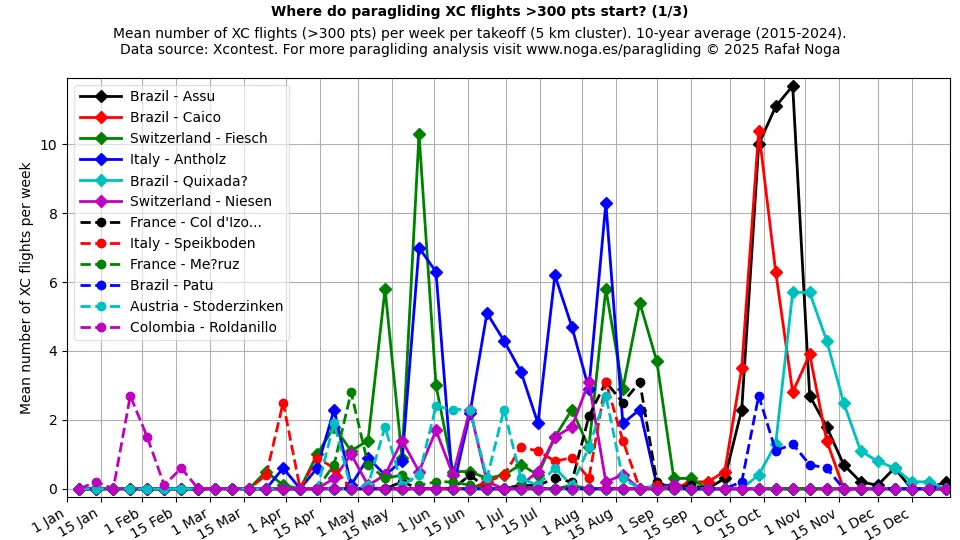
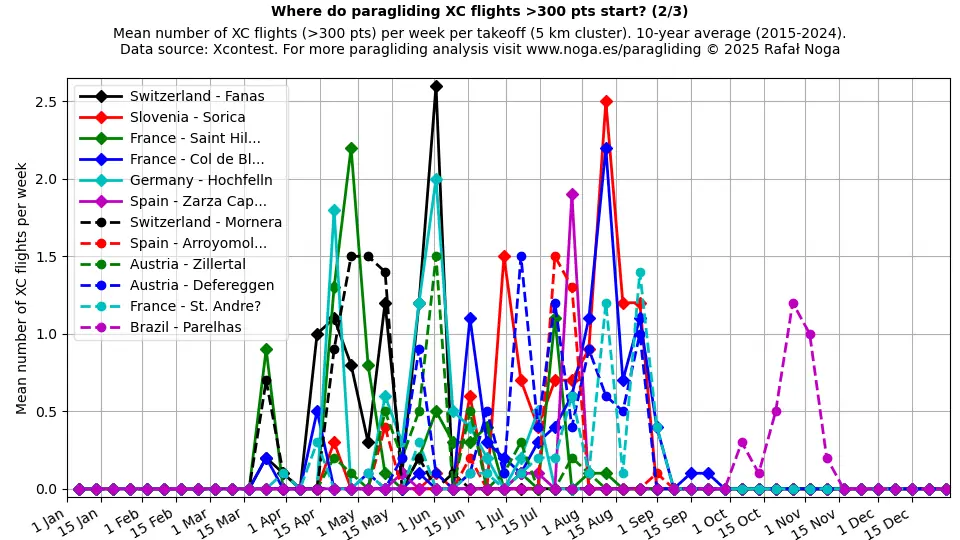
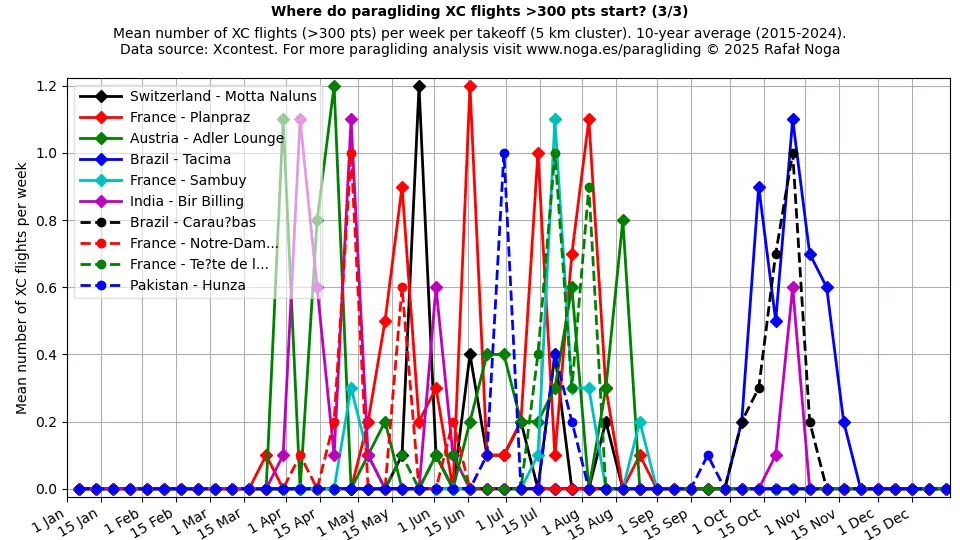
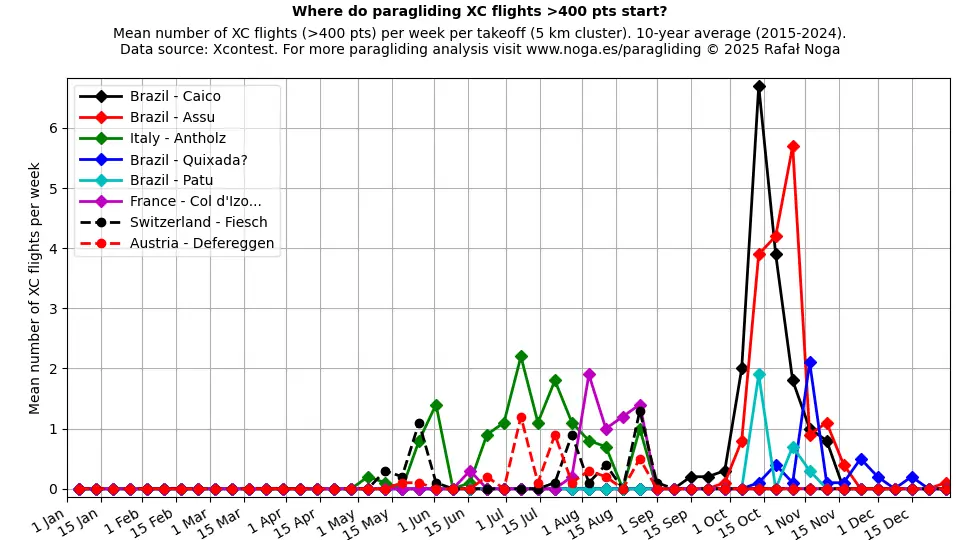
Where Do High-Scoring Paragliding XC Flights Start?
Average number of XC flights per week per takeoff (2 km+4 km two-pass cluster), 11-year average (2015–2025). Data source: Xcontest.
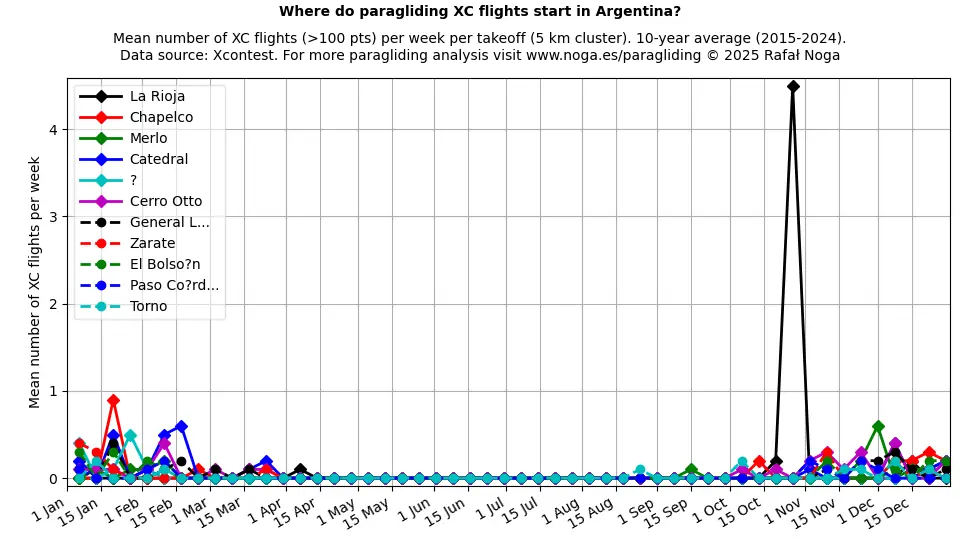
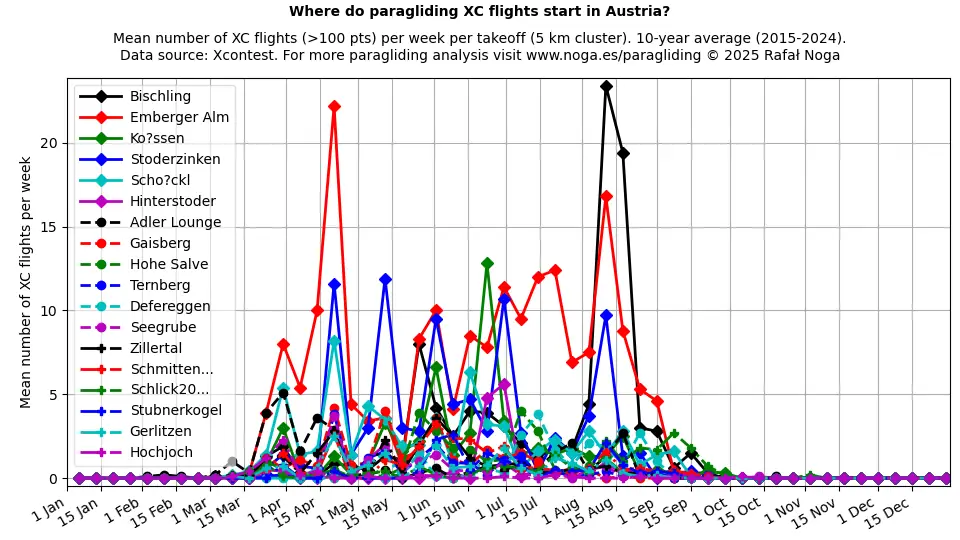
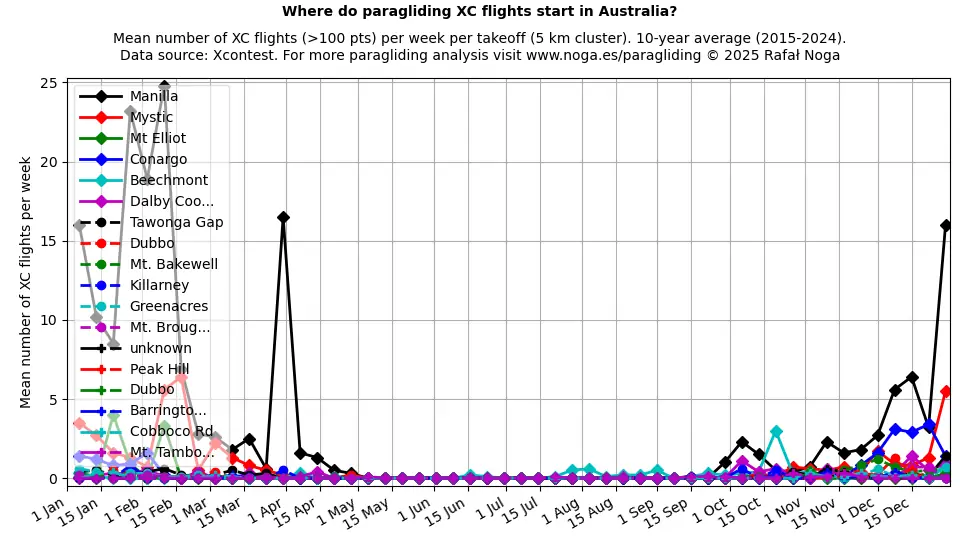
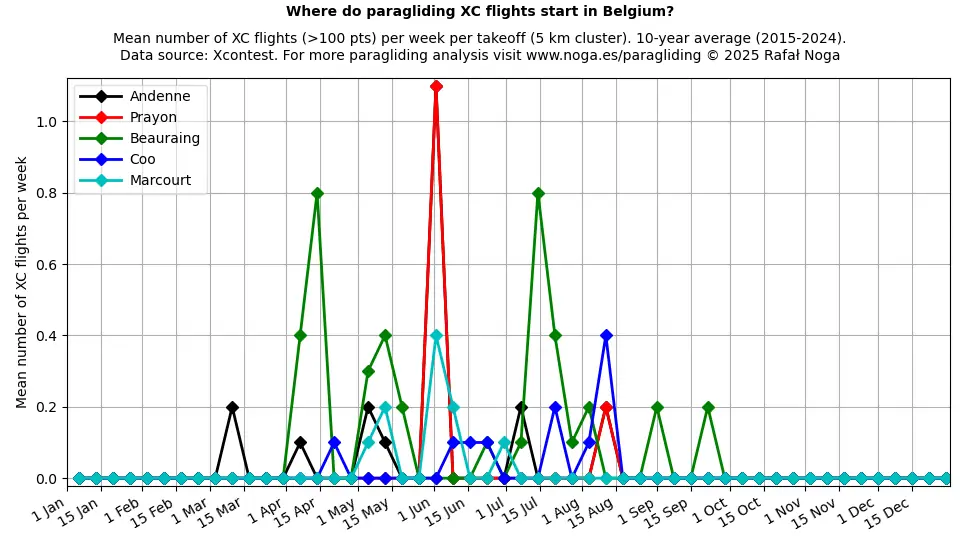
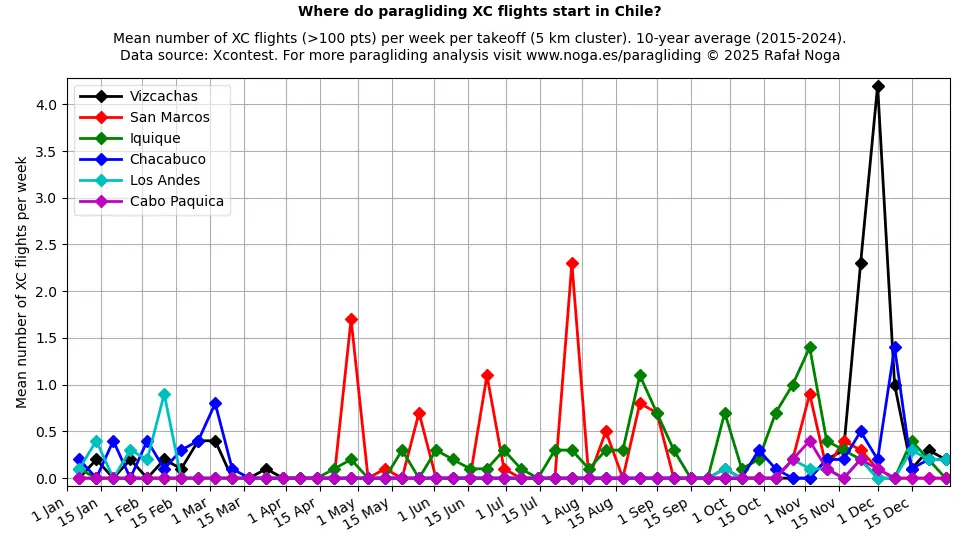
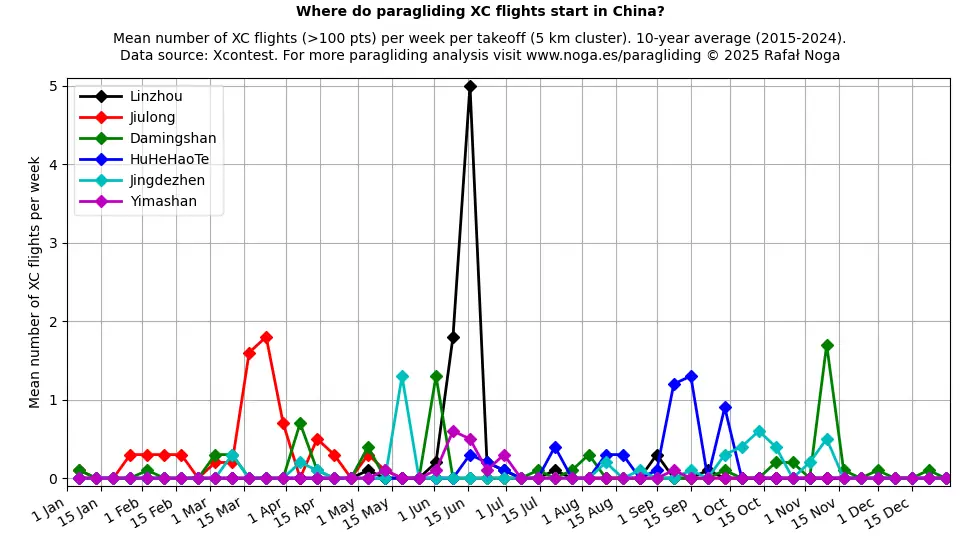
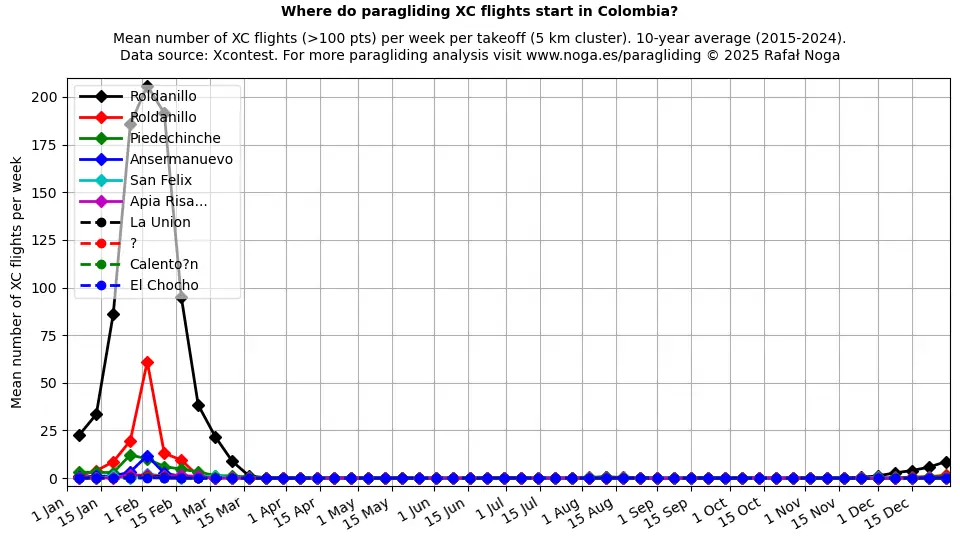
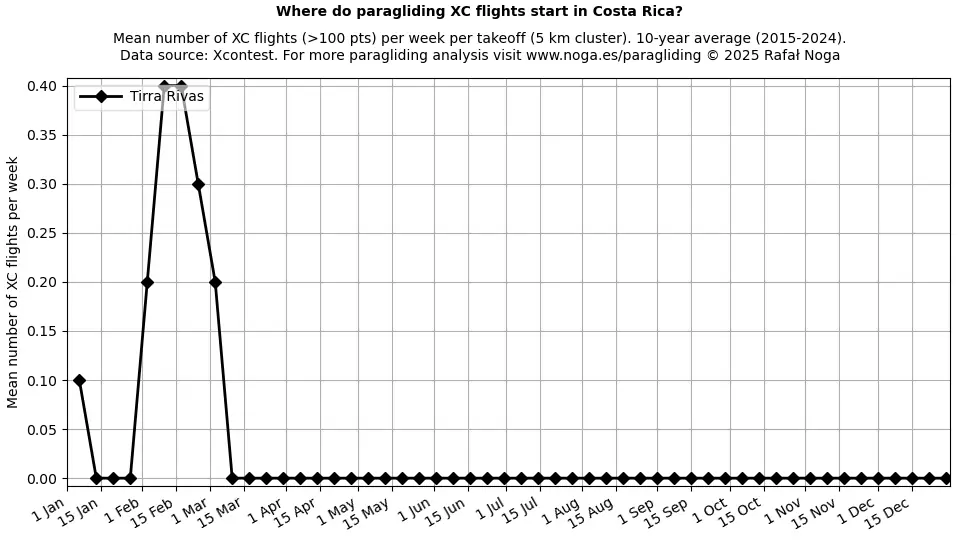
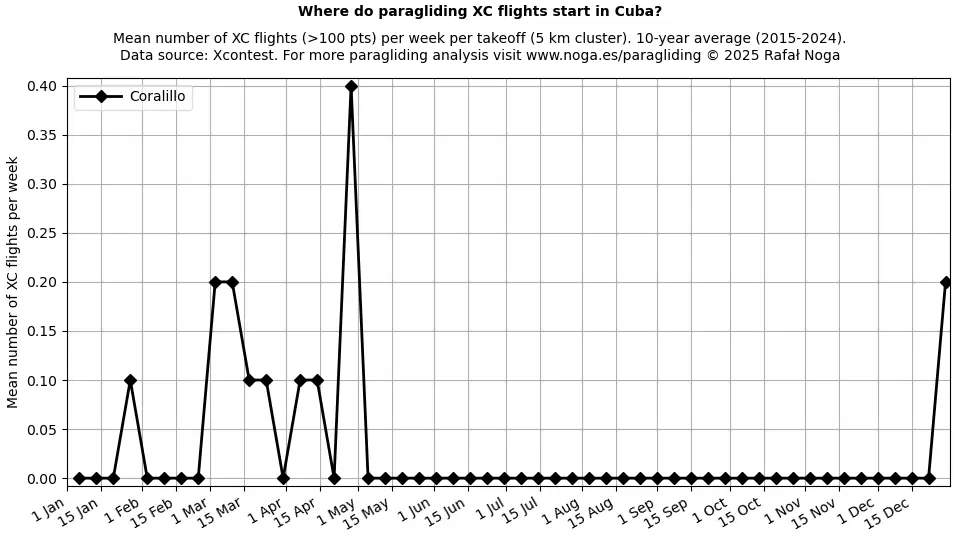
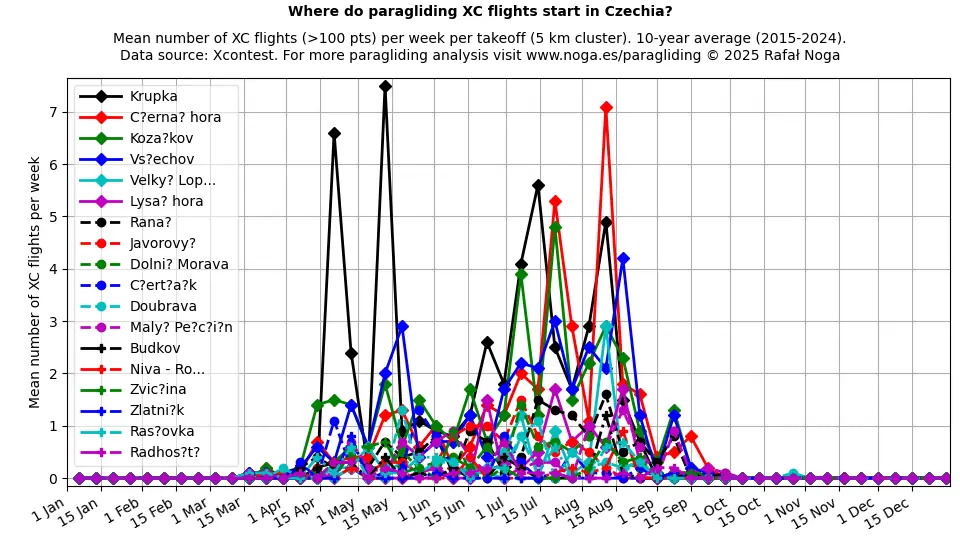
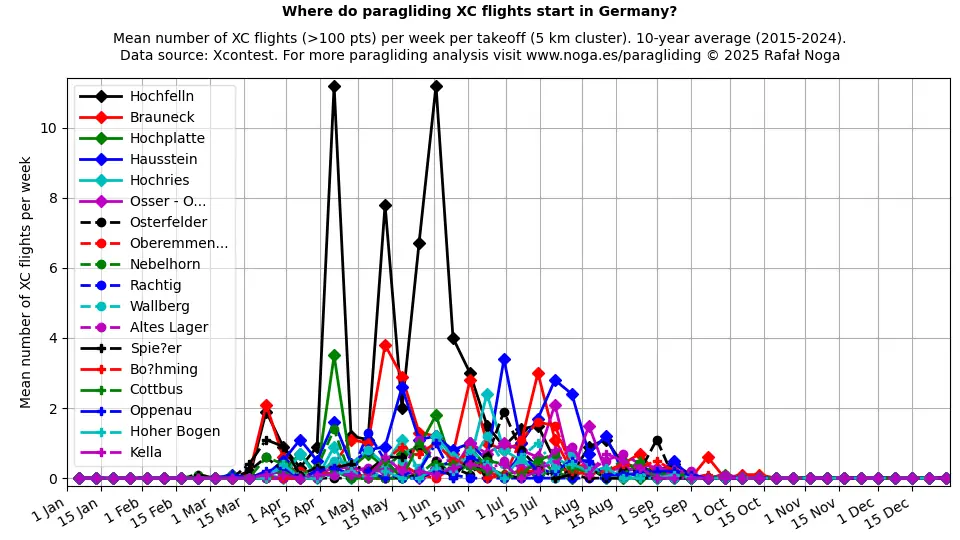
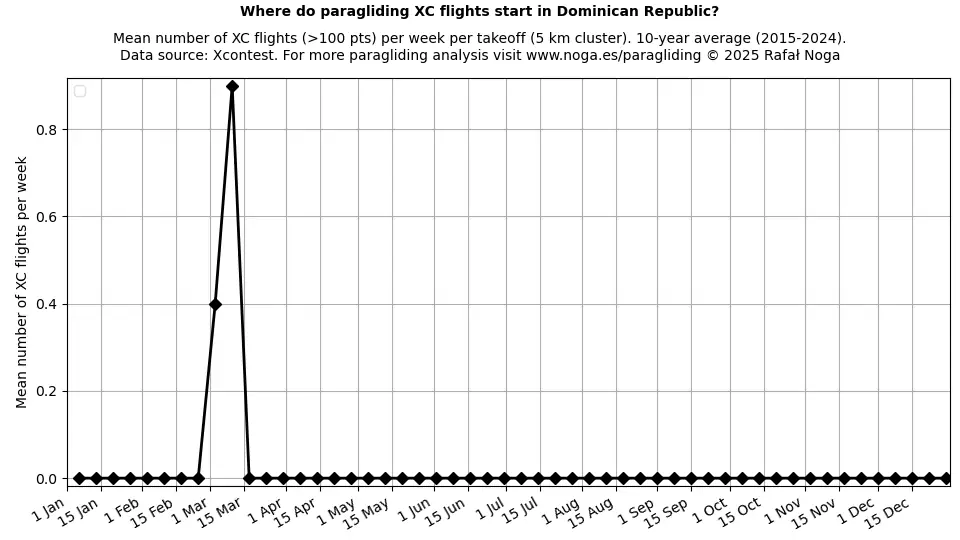
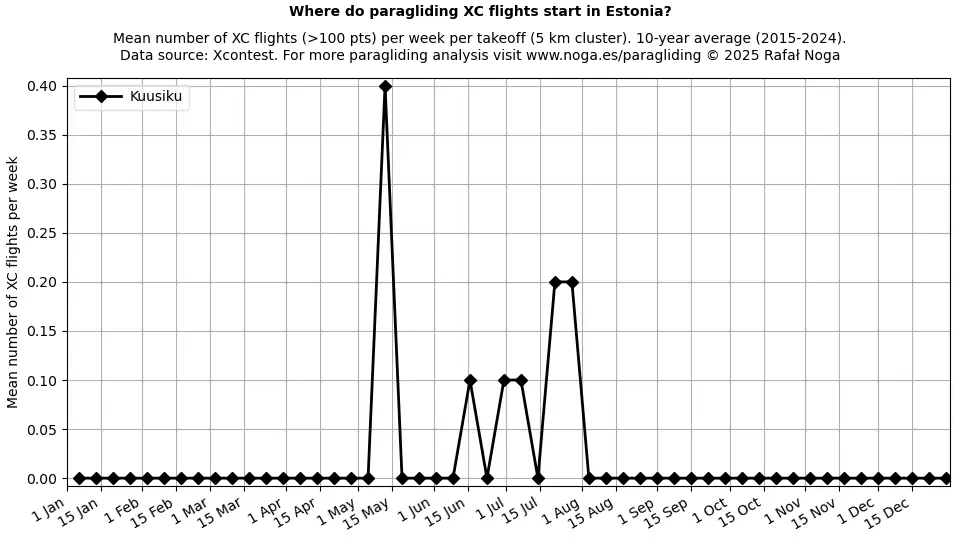
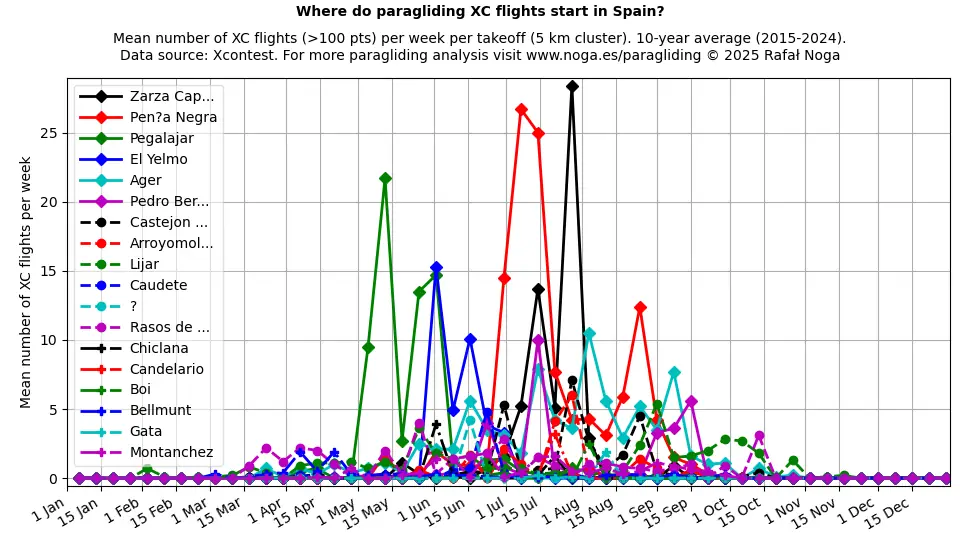
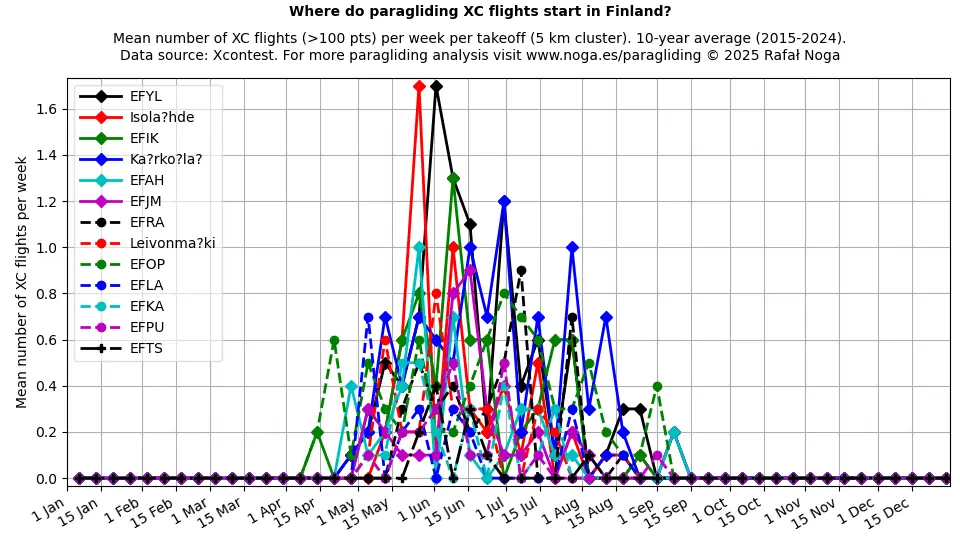
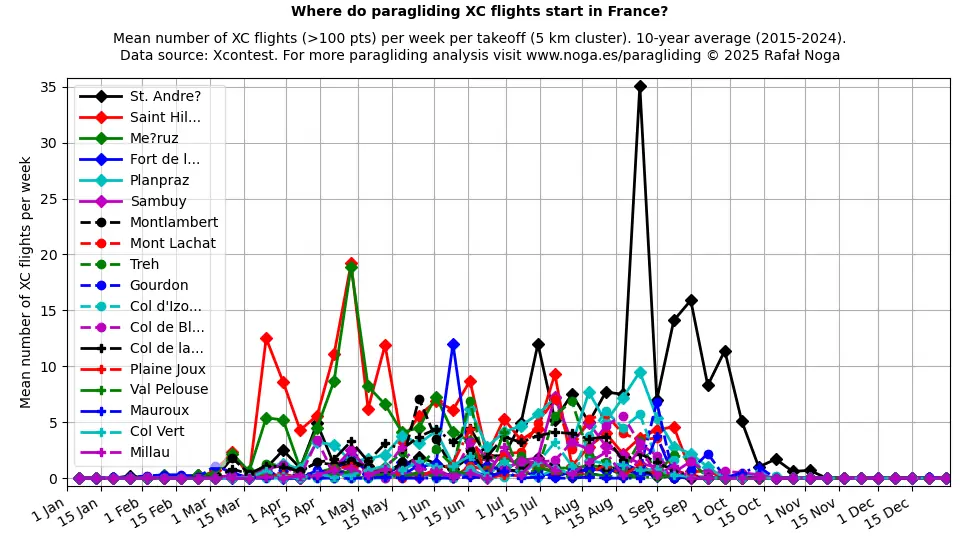
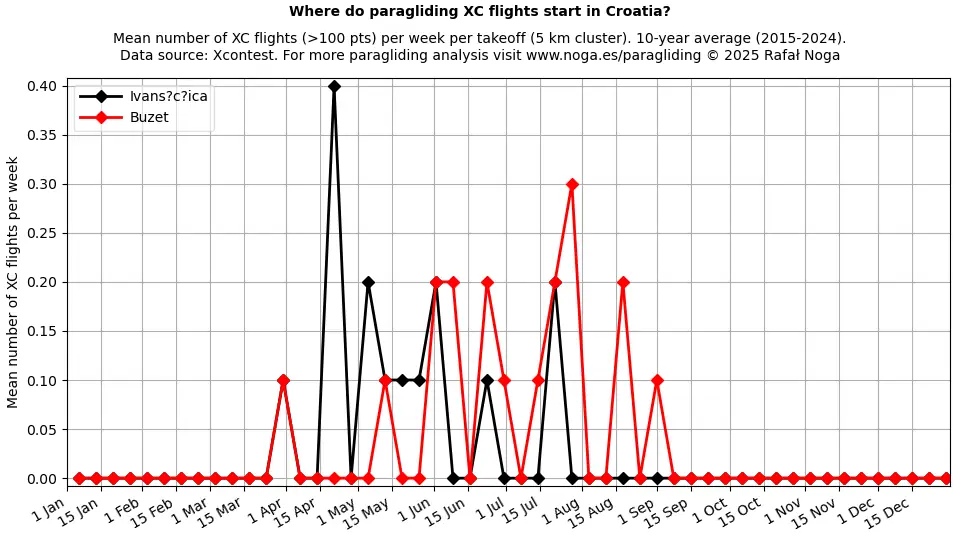
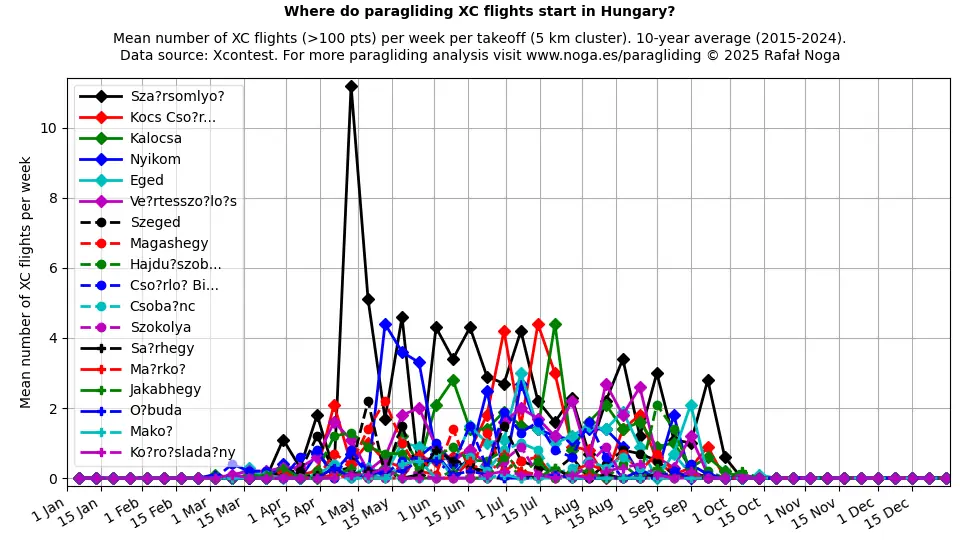
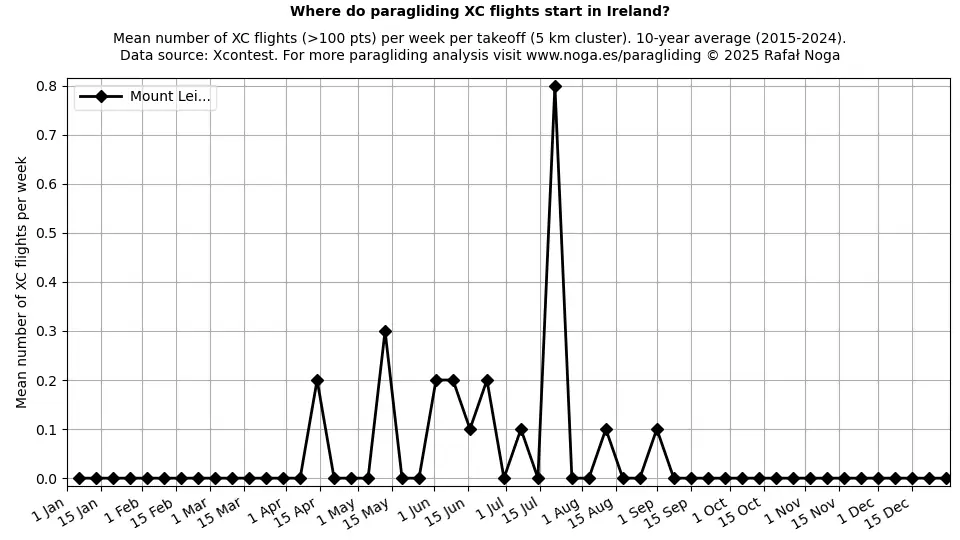
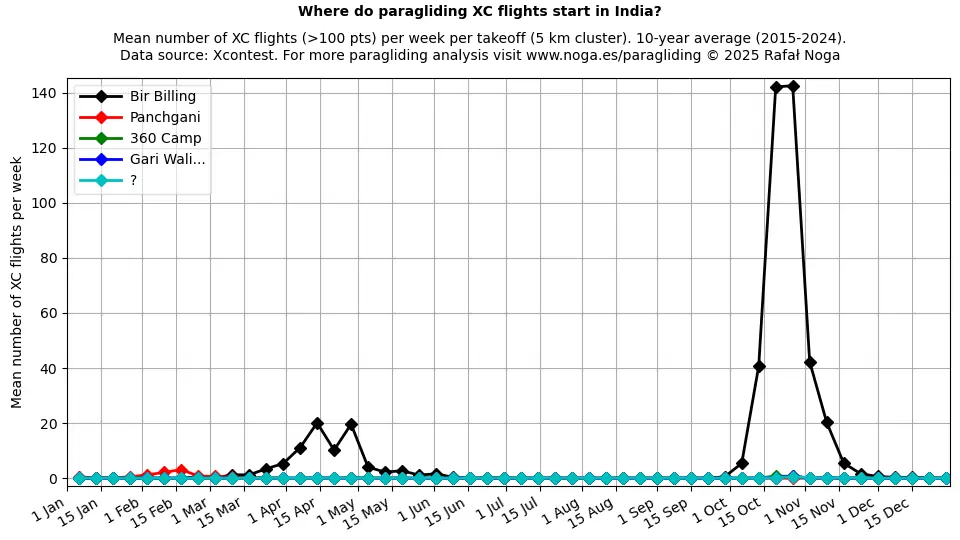
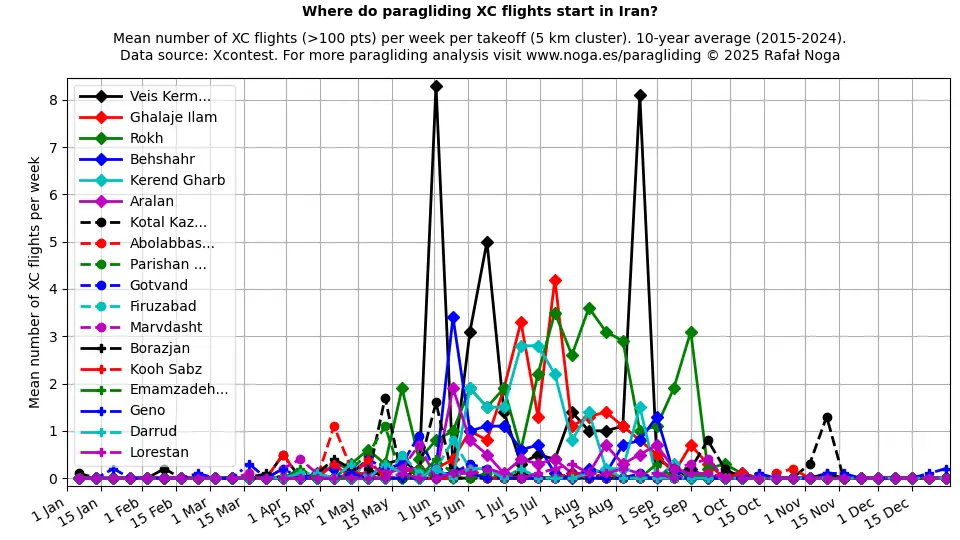
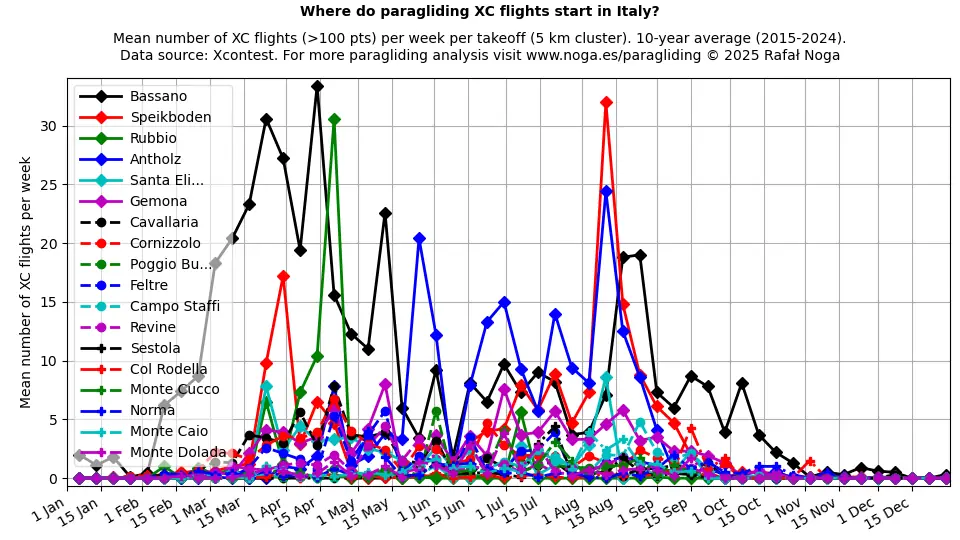
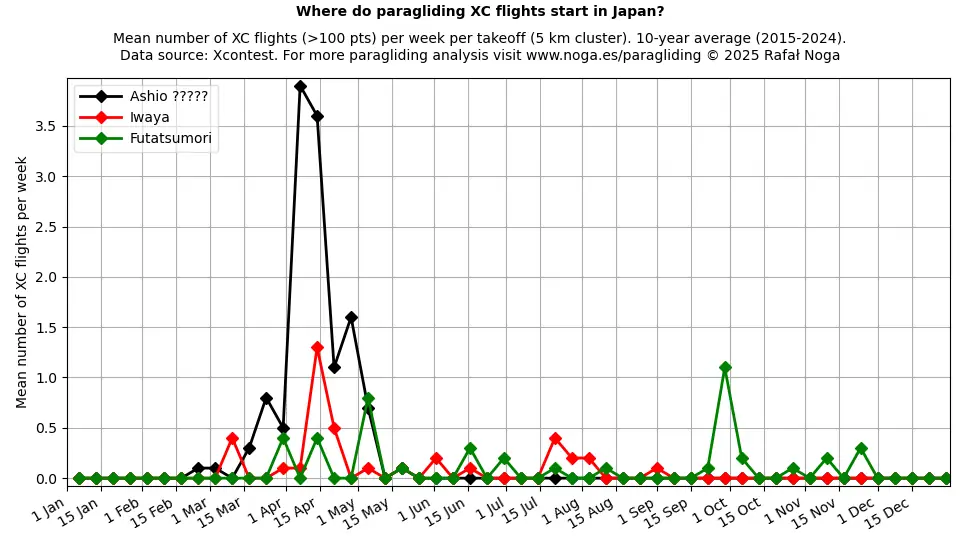
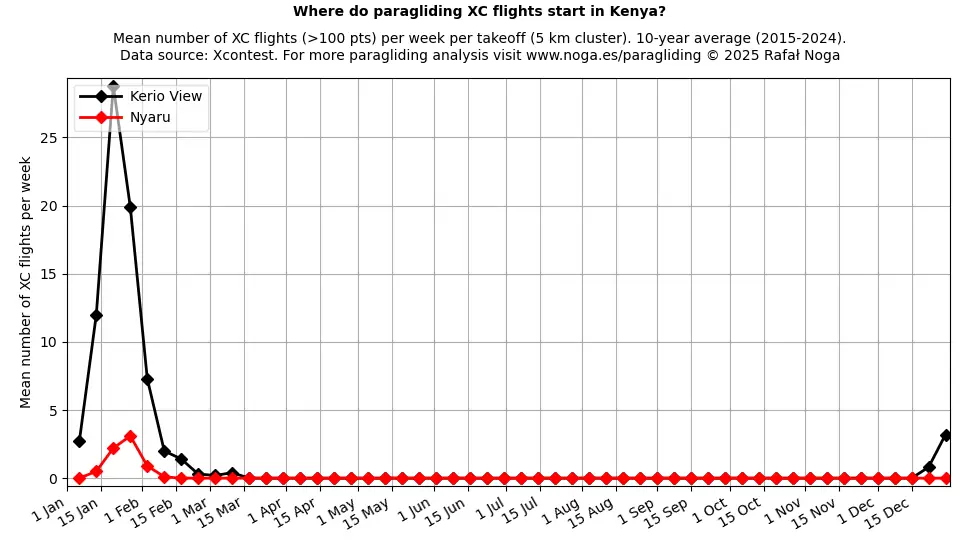
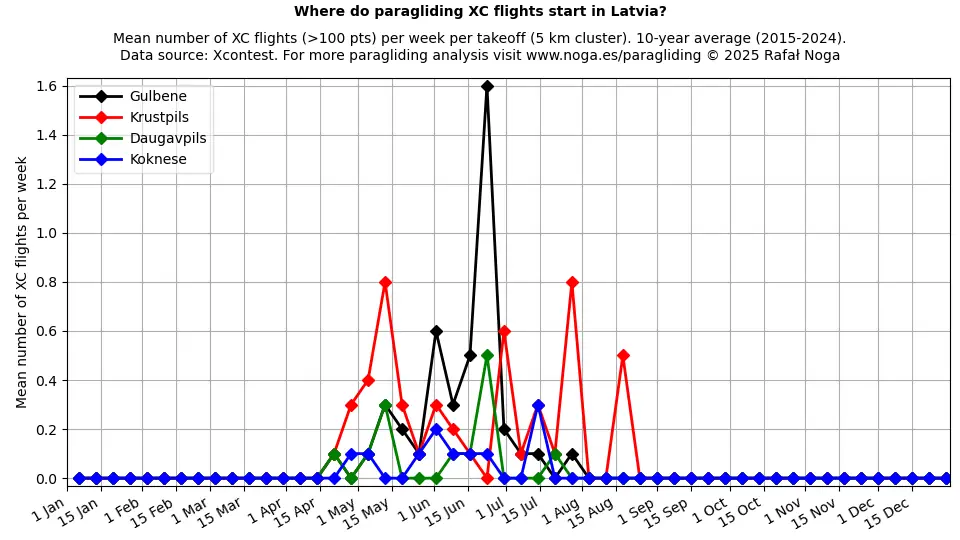
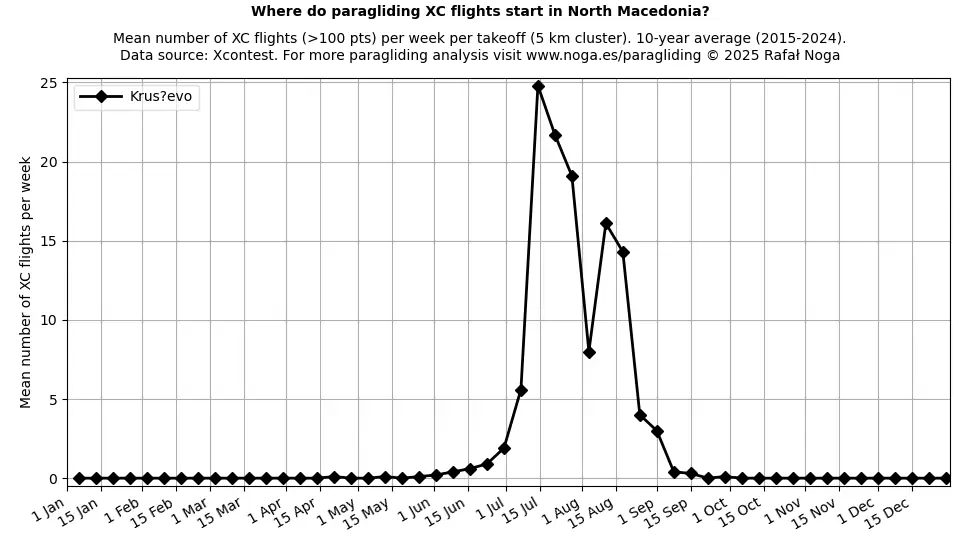
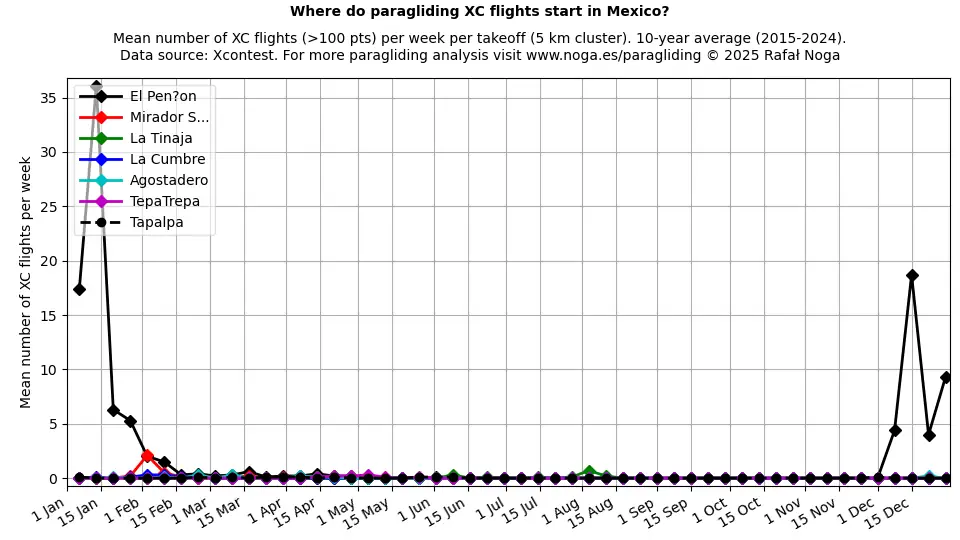
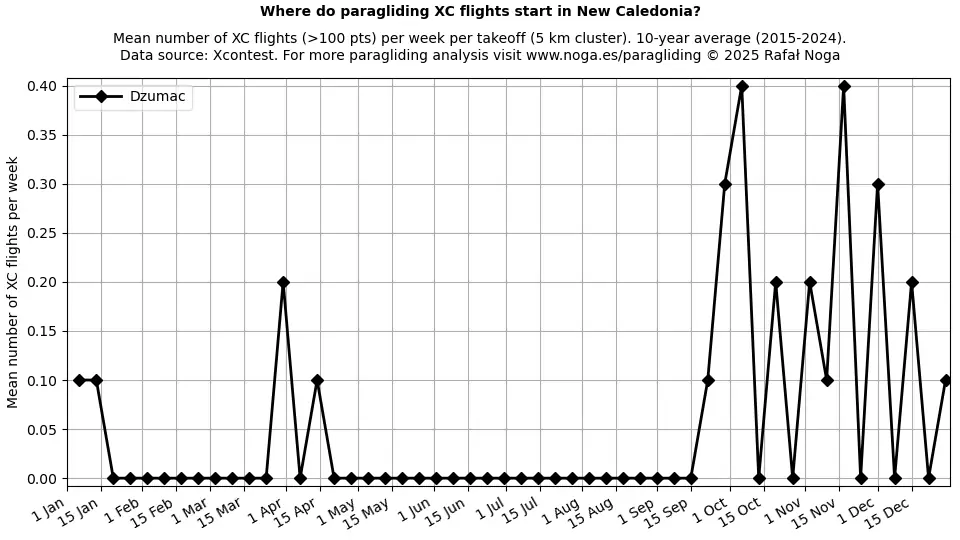
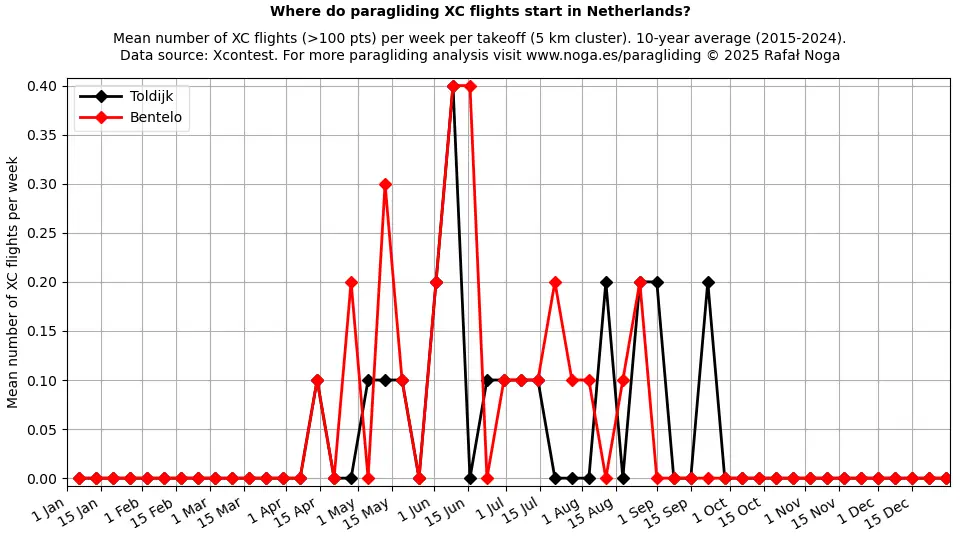
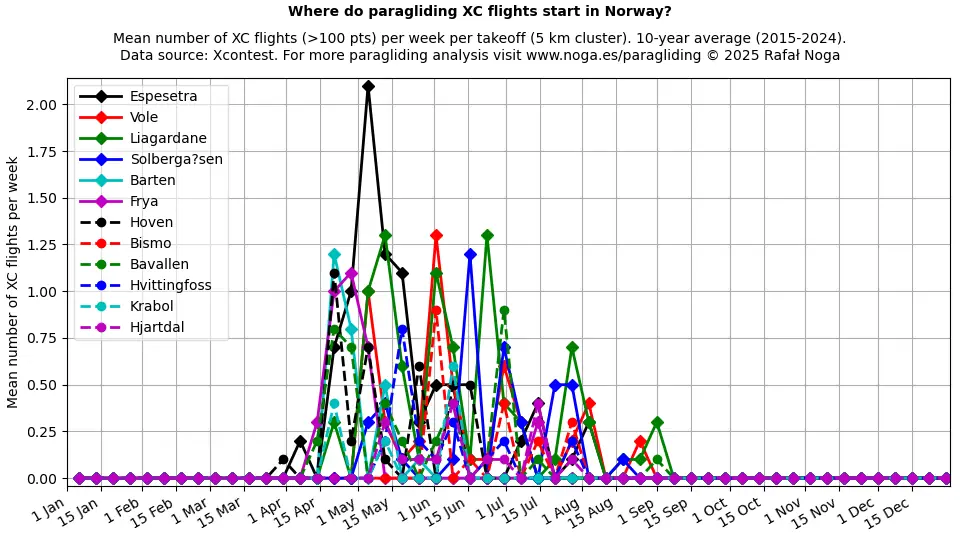
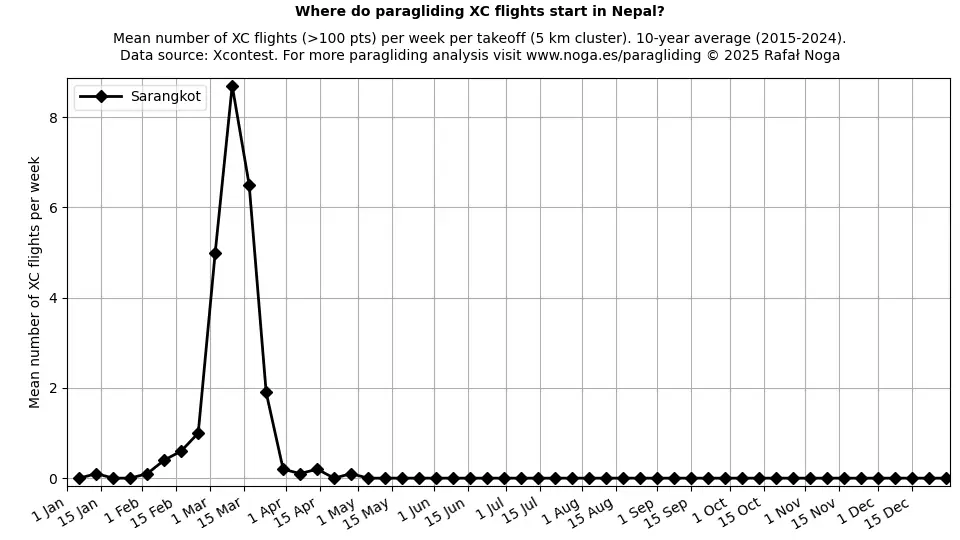
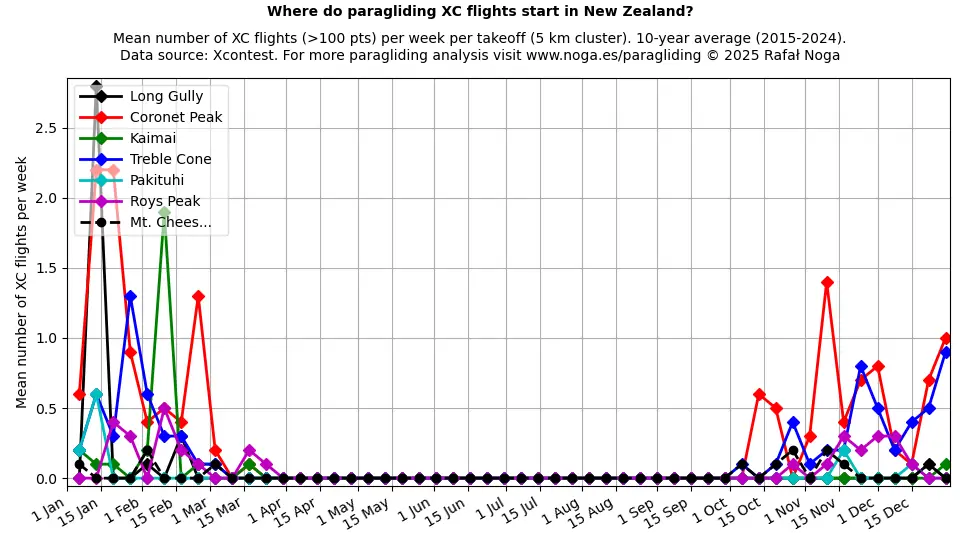
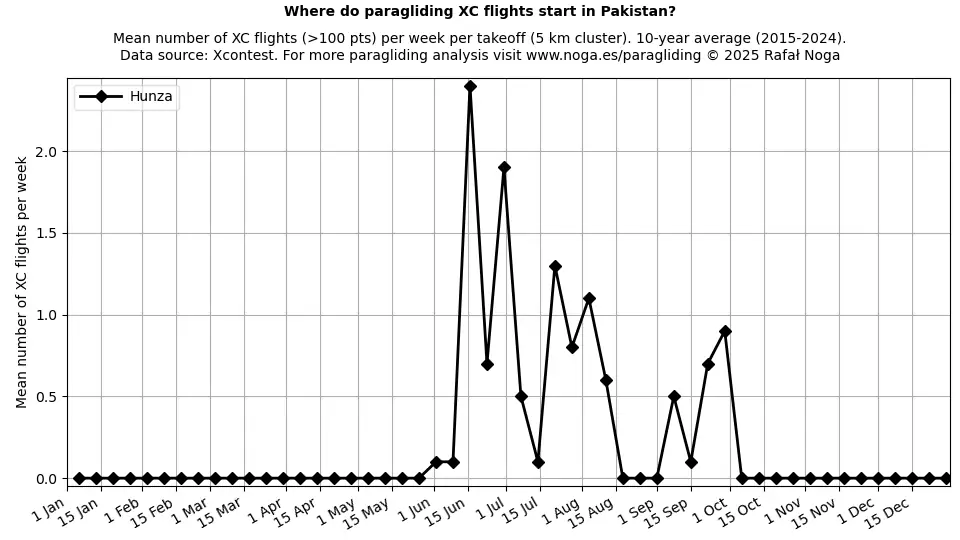
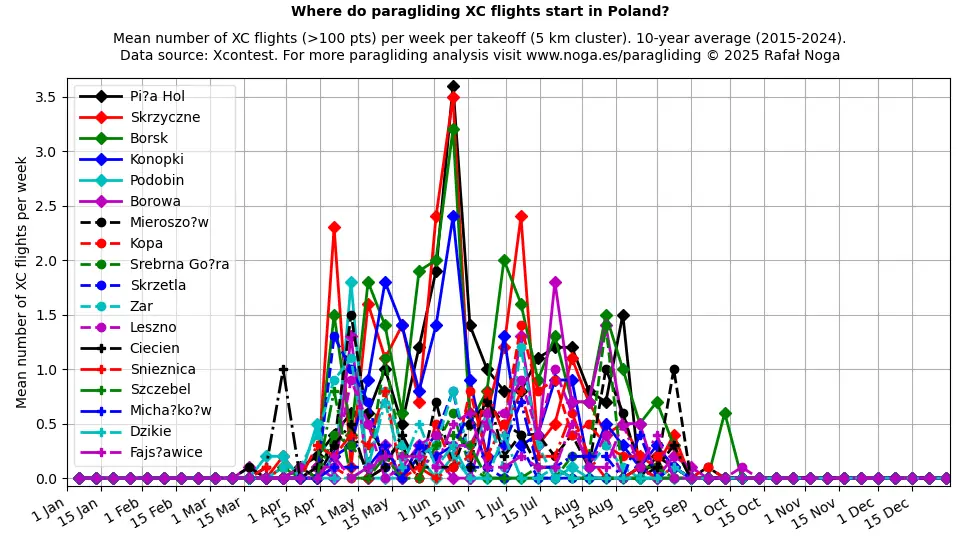
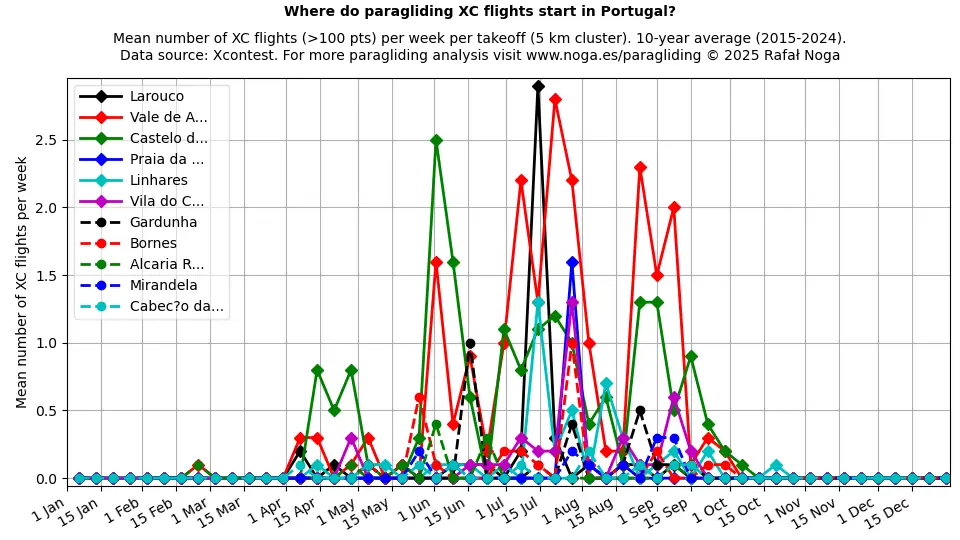
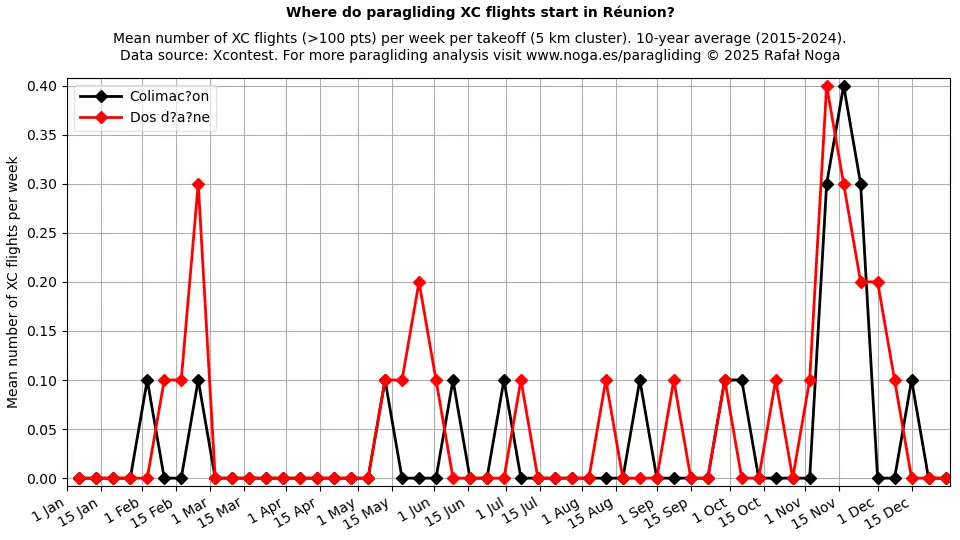
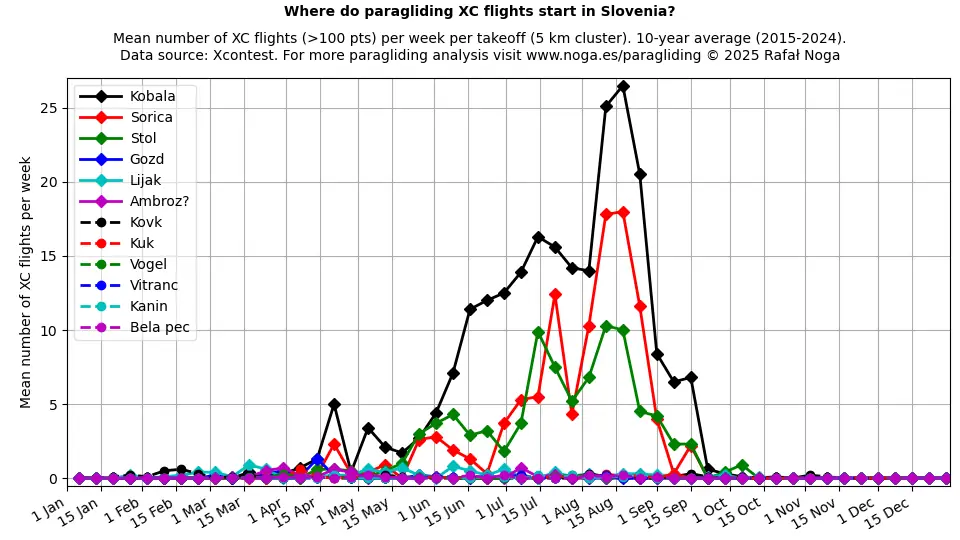
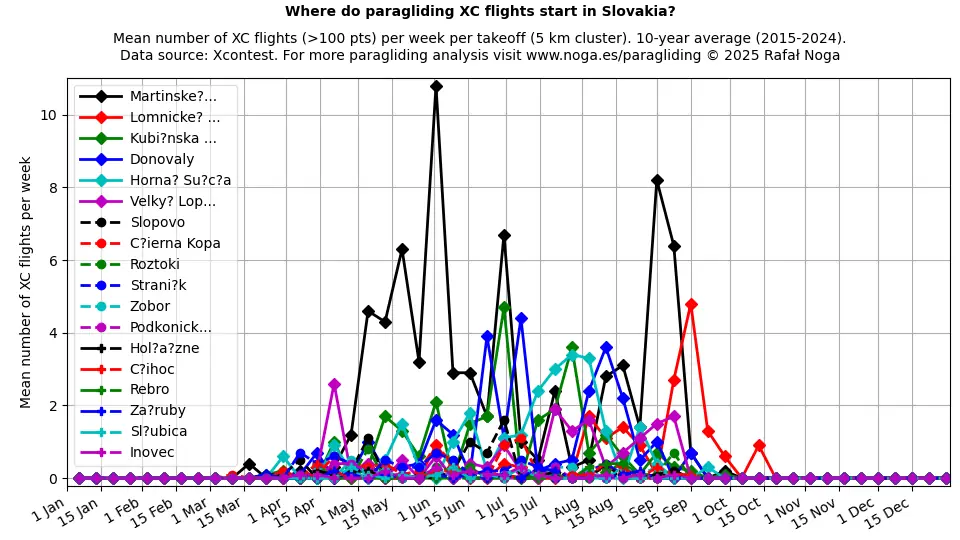
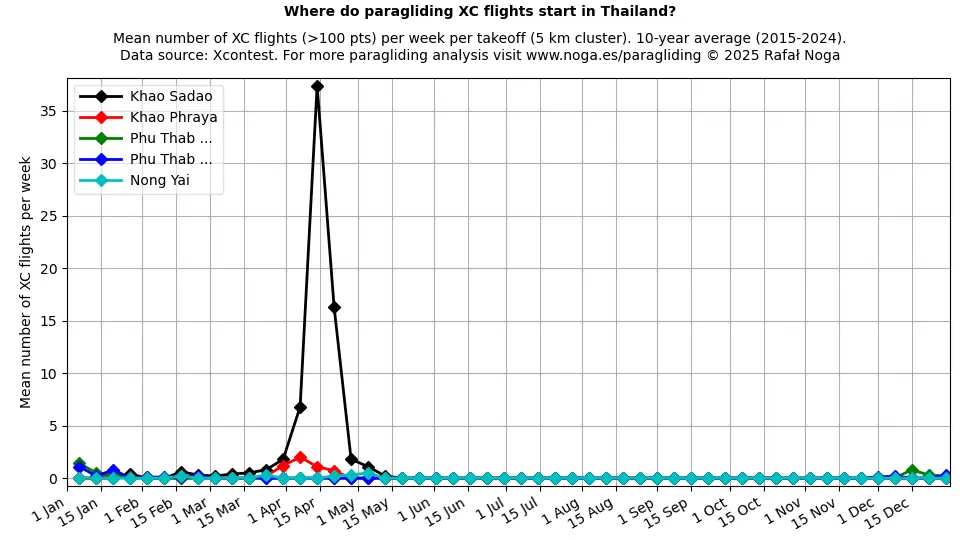
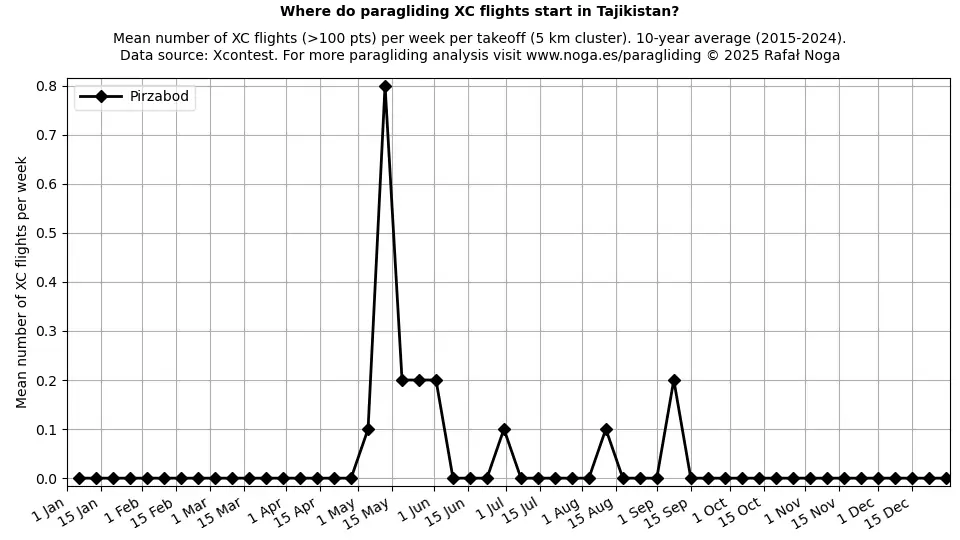
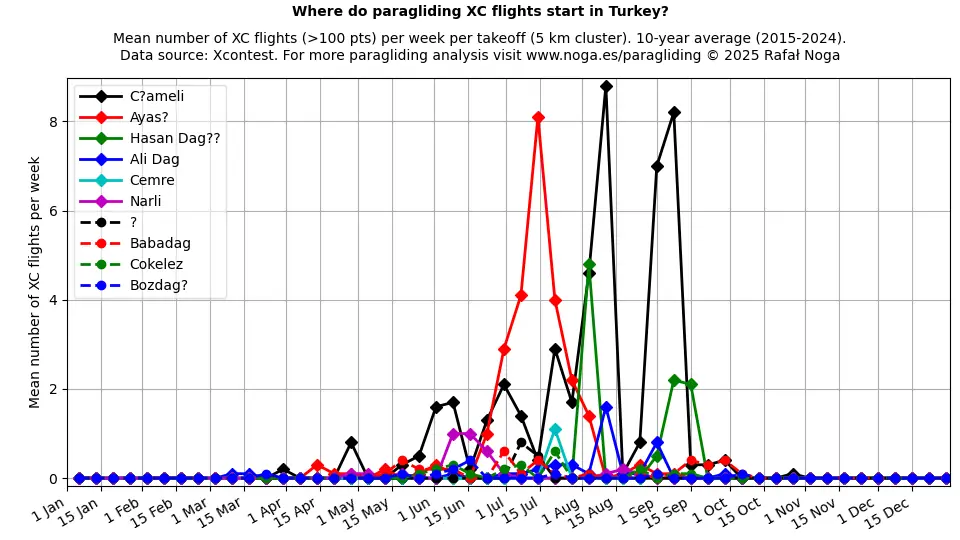
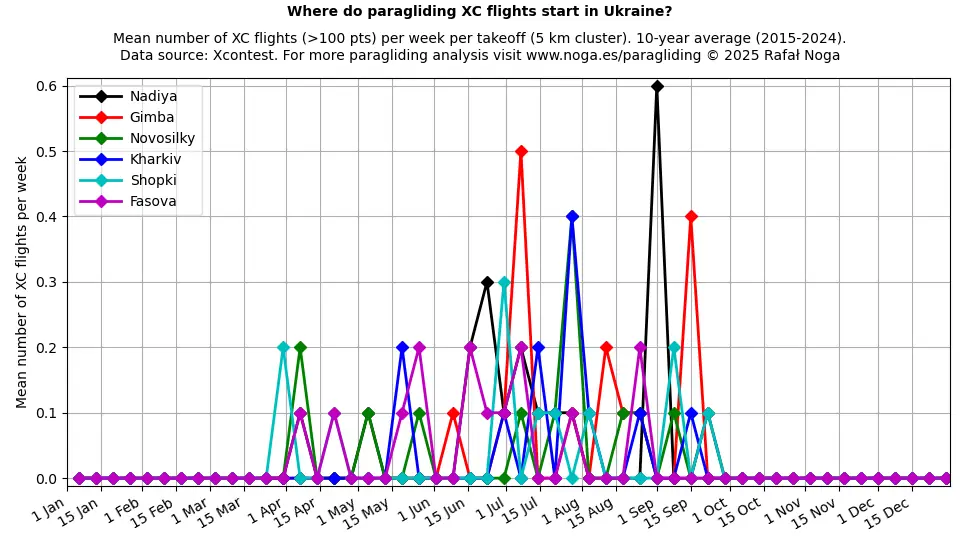
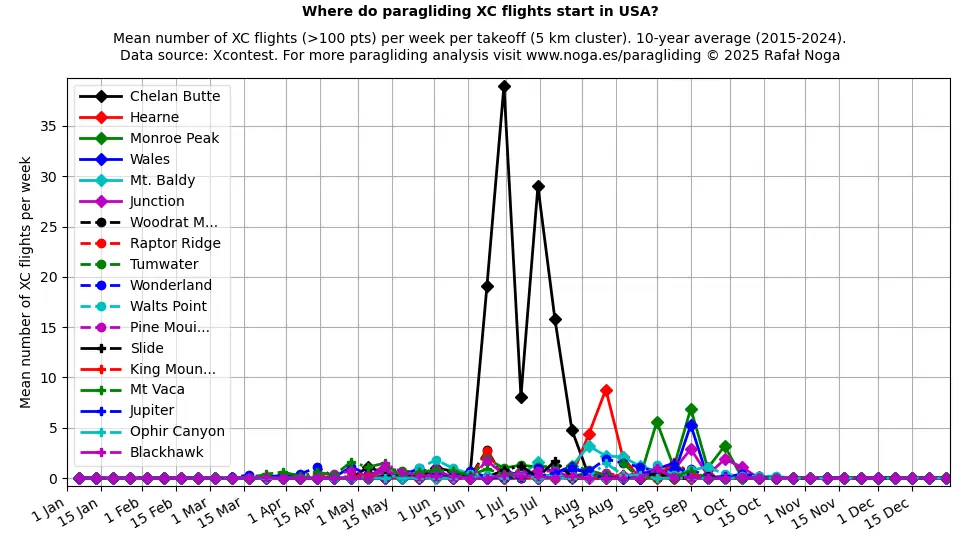
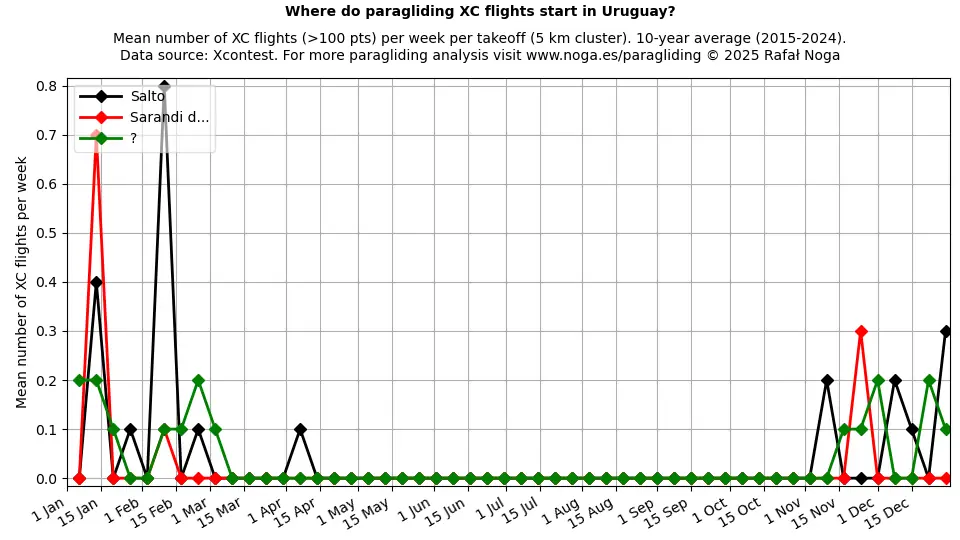
Most Frequented XC Takeoffs by Country
Average number of XC flights (>100 points) per week per takeoff (2 km+4 km two-pass cluster), 11-year average (2015–2025). Click on any chart to view full size. Data source: Xcontest.
Built by an engineer
This analysis was built with Python, data science & automation — the same skills I apply to industrial process control.
Let's Connect
Telegram Group
Join the Paragliding Data Analysis group on Telegram — discuss XC data, analyses, and flying spots with other pilots.
Join on TelegramSupport this project
Like this analysis? Help keep it updated with a small contribution.
Stay Updated
Get notified when new paragliding analyses and data are published.
Work with me
Advertising
This page reaches thousands of paragliding pilots worldwide every month. Here's how we can collaborate:
- Advertise: Banner or sponsored listing for your flying school, gear shop, retrieval service, or XC guiding.
- Affiliate partnerships: I recommend gear, varios, harnesses — let's set up affiliate links to your shop.
- Sponsored data reports: Commission a detailed custom XC analysis for your region or country (PDF or interactive).
- Flying school & guide directory: Get a premium listing next to your country's takeoff data.
- Tourism boards & destinations: Data-driven proof that your region is a world-class XC destination — attract more pilots.
- Newsletter sponsorship: Reach the subscriber base directly with a sponsored slot.
Interested? Get in touch
Engineering Services
Beyond paragliding data, I'm a freelance engineer specializing in paraglider-wing-based systems. Formerly at SkySails, working on Airborne Wind Energy (energy generation using tethered wing/kite systems). I offer:
- Data analysis & visualization: Custom statistical analysis, dashboards, and interactive reports from flight or sensor data.
- Modelling & simulation: Dynamic models for aerodynamic, mechanical, and energy systems.
- Control systems & MPC: Advanced process control, model predictive control, and optimization-based control design.
- Trajectory optimization: Optimal flight paths, setpoint generation, and constraint-aware planning.
- Sensor fusion & state estimation: EKF/UKF, observer design for robust real-time estimation.
Learn more at noga.es
Powered Paragliding (PPG) XC Map
Also flying with a motor? Explore 1,684 powered paragliding takeoff areas worldwide — an interactive map based on 11 years of Xcontest PPG data (2014–2024).
PPG XC Takeoff Map →Contact
Have questions or suggestions?
See something interesting or want a specific analysis? Get in touch.